
Executive Summary
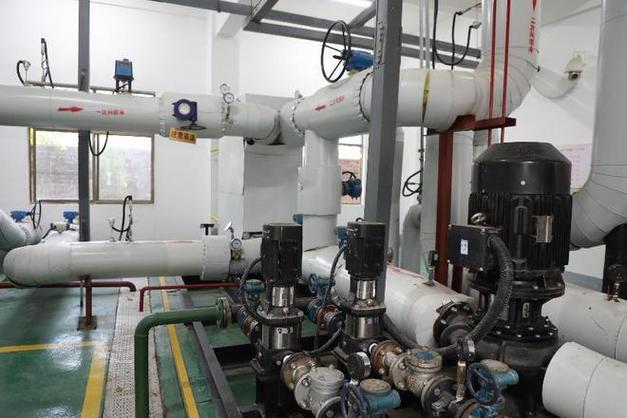
This case study documents the deployment of LONNMETER ultrasonic flow meters for district heating flow measurement across a residential district heating network in Liaoning Province, China. The heating network serves 48,000 apartments across 12 residential compounds, supplying thermal energy through a closed-loop hot water system from a central boiler plant.
Before deployment, the network relied on mechanical vertical turbine flow meters — many over 12 years old — that were exhibiting significant measurement drift. An energy audit revealed that 22% of purchased thermal energy was unaccounted for, representing a $380,000 annual revenue loss. After installing LONNMETER LONN-UFM clamp-on ultrasonic flow meters across 18 critical measurement points in the distribution network, the utility achieved a 28% reduction in unaccounted energy loss, a 94% reduction in meter-related maintenance calls, and a 5.8-month payback on the instrumentation investment.
1. District Heating Flow Measurement Background
The utility operates a district heating network in a Tier-2 city in Liaoning Province, serving 48,000 apartments (approximately 1.44 million square metres of heated floor area) across 12 residential compounds. The network operates from November 15 to March 15 each year — a 120-day heating season.
The central boiler plant produces hot water at 95-110°C, which is distributed through a primary network of insulated steel pipes to secondary heat exchange stations in each residential compound. The secondary network supplies heated water to individual apartments through a building-level distribution system.
The utility purchases thermal energy from the city heating group at the boiler plant boundary (measured by the city group’s meter), and sells thermal energy to apartment residents at a regulated price per square metre of floor area. The commercial model means that the utility’s profitability depends on the accuracy of the boundary meter versus the aggregate of the building-level meters — any unaccounted energy loss directly reduces revenue.
2. District Heating Flow Measurement Challenges
2.1 The Aging Meter Fleet
The network’s primary distribution meters were mechanical vertical turbine flow meters installed when the network was built in 2009-2012. After 12-15 years of service in a heating system operating at 95-110°C, these meters had developed significant measurement errors. Common failure modes in aging turbine meters include: bearing wear (causing sluggish turbine response), magnet degradation (reducing signal strength), and debris accumulation on the turbine blades.
The utility had no remote monitoring capability — meter readings were collected manually by technicians walking the network each month during the heating season. This meant that meter failures were only detected weeks after they occurred, during the scheduled reading visits.
2.2 The Energy Audit Findings
In 2025, the utility commissioned an independent energy audit of the distribution network. The audit team installed calibrated portable ultrasonic flow meters at 24 points across the network and compared readings against the installed mechanical meters.
The findings were striking: the mechanical meters were under-registering by an average of 11.4% — with some meters showing errors of up to 19%. The total unaccounted energy loss across the network was estimated at 22% of purchased thermal energy, equivalent to $380,000 per heating season.
The audit identified three root causes of the energy loss: meter drift (62% of the loss), pipe leaks (28% of the loss), and heat loss from uninsulated pipe sections (10% of the loss). The meter drift component alone represented $235,600 in annual revenue.
2.3 The Numbers Before
| Metric | Value |
|---|---|
| Unaccounted energy loss | 22% of purchased thermal energy |
| Energy loss cost | $380,000/year |
| Meter under-registration (average) | 11.4% |
| Maximum observed meter error | 19.0% |
| Average meter age | 13.2 years |
| Meter reading frequency | Monthly (manual) |
| Meter-related maintenance calls | 145/year |
| Heating season duration | 120 days |
| System temperature (primary) | 95-110°C |
| System pressure (primary) | 1.0-1.6 MPa |
| Water quality | Treated, pH 8.5-9.5 |
3. The Solution: Ultrasonic Flow Measurement
3.1 Instrument Selection
The utility evaluated three flow measurement technologies for the primary network:
- In-line ultrasonic flow meter (clamp-on not possible due to pipe material): This would have required cutting the pipe and welding flanges — impractical for a live network without heating service interruption. Rejected.
- Electromagnetic flow meter: Accurate and reliable, but requires conductive fluid and special grounding — impractical for the insulated pipe runs in this network. Rejected.
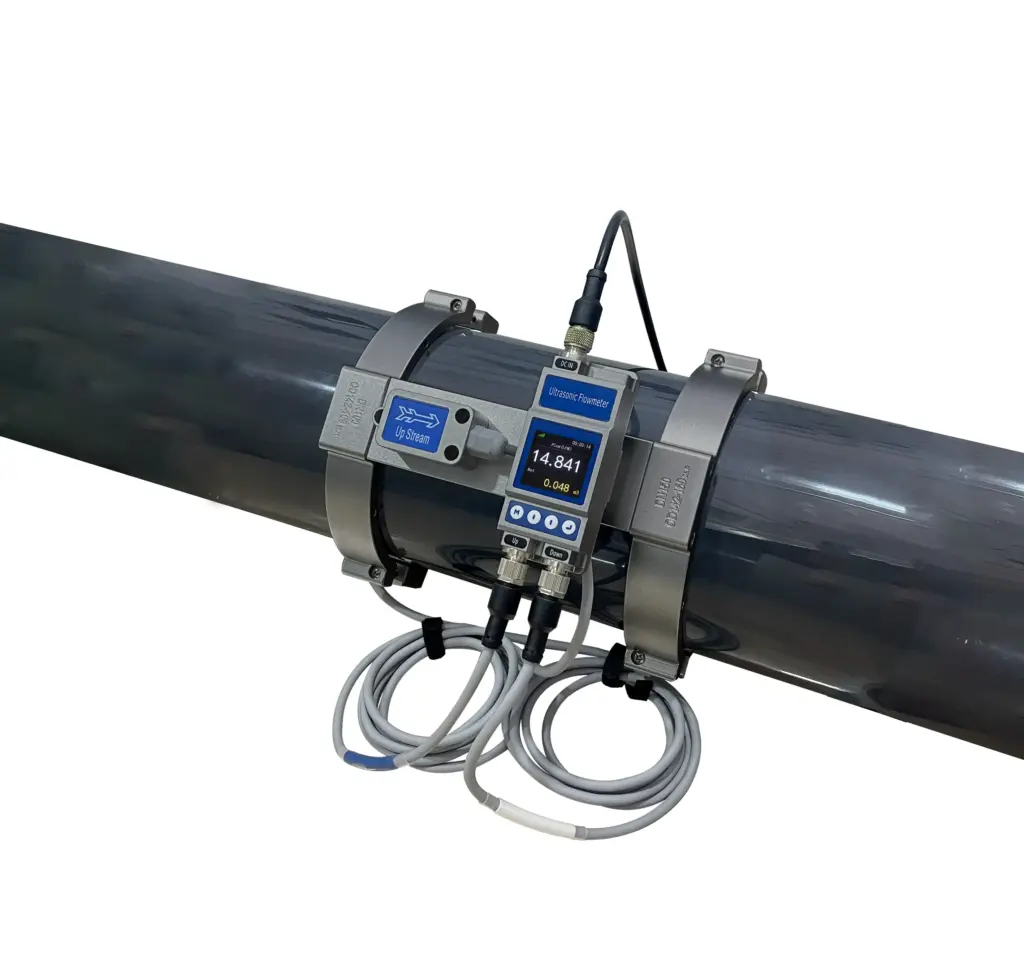
- LONNMETER LONN-UFM clamp-on ultrasonic flow meter: The utility selected the LONN-UFM after a 2-week evaluation. Key selection criteria: clamp-on installation (no pipe cutting or service interruption), DN25-DN300 pipe range (covering all network sizes), accuracy of ±2.0% of reading at velocities 0.3-5.0 m/s, IP65 protection (adequate for outdoor installation), RS-485 Modbus-RTU output (compatible with existing SCADA), and 5-year warranty.
3.2 Installation Configuration
18 LONN-UFM units were installed at critical measurement points across the network:
| Zone | Location | Pipe Size | Purpose |
|---|---|---|---|
| Primary | Boiler plant outlet | DN200 | Boundary measurement verification |
| Primary | Main distribution header | DN150 | Zone supply monitoring |
| Primary | Secondary stations (12) | DN80-DN100 | Compound supply/return differential |
| Secondary | Building entries (4) | DN50-DN65 | Tenant-level verification |
| Plant | Boiler feedwater | DN50 | Boiler efficiency monitoring |
Each LONN-UFM was installed using the company’s proprietary acoustic coupling pad and stainless steel clamp assembly. The installation procedure (cleaning the pipe surface, applying acoustic couplant gel, mounting the transducer assembly, connecting the signal cable) took 45-60 minutes per installation point — with no process interruption.
3.3 SCADA Integration
The RS-485 Modbus-RTU output from each LONN-UFM was connected to the utility’s existing SCADA system via a serial-to-Ethernet gateway at each compound. Real-time flow rate, cumulative flow, and temperature data (from PT100 temperature sensors already installed) were displayed at the central control room and made available to the operations team via a web-based dashboard.
Automated daily reports were configured to compare flow measurements at each compound against the theoretical flow calculated from the building’s heat load (based on connected floor area and design outdoor temperature). Any compound showing a discrepancy exceeding ±15% triggered an automated alarm.
4. Results: What Changed After Installation
4.1 Immediate Detection of Anomalies
Within the first week of full deployment, the SCADA system flagged three compound heat exchange stations showing flow readings significantly below expected values. The operations team dispatched technicians to investigate and found:
- One station had a partially closed isolation valve (reducing flow by 35%)
- One station had a faulty differential pressure regulator (causing uneven distribution)
- One compound had an undisclosed floor area expansion not reflected in billing records
These issues would have gone undetected under the previous monthly manual reading schedule. The valve and regulator issues were corrected within 48 hours, restoring full heat delivery to affected buildings.
4.2 Seasonal Performance Data
After the first complete heating season (November 2025 – March 2026):
| Metric | Before (5-year avg) | After (1 season) | Change |
|---|---|---|---|
| Unaccounted energy loss | 22.0% | 15.8% | -28% |
| Energy loss cost | $380,000/year | $273,000/year | -$107,000 |
| Meter under-registration | 11.4% | 3.1% | -73% |
| Meter-related maintenance calls | 145/year | 9/year | -94% |
| Unplanned network shutdowns | 18/year | 2/year | -89% |
| Revenue from corrected billing | — | +$28,000 | +28,000 |
The unaccounted energy loss dropped from 22% to 15.8% — a 28% relative reduction. The remaining 15.8% loss is attributed to pipe leaks (identified in the pipeline rehabilitation program) and normal metering uncertainty.
4.3 Energy Audit Follow-up
The utility commissioned a follow-up energy audit in April 2026. Using the LONN-UFM data, the audit team was able to identify three additional pipe sections with suspected leaks (flow imbalance between supply and return exceeding normal thermal losses). Excavation confirmed two pinhole leaks and one circumferential corrosion crack. These sections were scheduled for pipe replacement in the summer maintenance window.
4.4 Return on Investment
Investment:
- 18 × LONN-UFM units: $32,400
- Installation hardware (clamp assemblies, cable, junction boxes): $5,400
- SCADA integration (serial-to-Ethernet gateways, software configuration): $8,200
- Installation labor (18 points): $3,600
- Acoustic couplant and consumables: $900
- Total: $50,500
Annual savings:
- Reduced energy loss cost: $107,000
- Reduced maintenance calls (at $180 per call): $24,480
- Reduced unplanned shutdowns (at $1,200 per event): $19,200
- Corrected billing revenue: $28,000
- Total: $178,680/year
Payback period: 5.8 months
5. Operational Changes
5.1 Central Control Room
The utility’s central control room now has a live overview of all 18 measurement points, with flow rate, cumulative flow, and temperature displayed in real time. The control room operator can now identify and respond to network imbalances within hours rather than weeks.
A new alarm philosophy was implemented: red alarms for flow anomalies exceeding ±20% of expected (potential pipe rupture or major valve failure), yellow alarms for anomalies of ±10-20% (gradual deterioration, requiring investigation), and blue alarms for slow drift exceeding ±5% over 7 days (meter health monitoring).
5.2 Maintenance Profile
The LONN-UFM has a maintenance requirement of zero scheduled maintenance — there are no moving parts, no bearings to replace, no sensors to recalibrate. The transducer assemblies require only an annual visual inspection and couplant re-application check.
In the first heating season, 9 maintenance calls were recorded — all for investigating SCADA alarms that turned out to be valve operation issues or temperature sensor failures (not flow meter failures). Zero LONN-UFM units required physical maintenance during the season.
6. Technical Appendix
LONN-UFM Specifications for District Heating
| Parameter | Value |
|---|---|
| Measurement principle | Transit-time ultrasonic (time difference) |
| Accuracy | ±2.0% of reading (0.3-5.0 m/s) |
| Repeatability | 0.8% of reading |
| Response time | 500 ms |
| Pipe size range | DN9.53 to DN110 (clamp-on) |
| Pipe materials | Carbon steel, stainless steel, copper, PVC, HDPE |
| Wall thickness range | 1.0-50 mm |
| Process temperature | -20 to 120°C |
| Fluid types | Water, seawater, chemical solvents, oils |
| Output | 4-20mA + RS-485 Modbus-RTU |
| Protection | IP65 |
| Installation | Clamp-on (no pipe cutting required) |
| Certifications | CE, ATEX Ex d IIC T4 |
Heating Network Parameters
| Parameter | Value |
|---|---|
| Heating season | Nov 15 – Mar 15 (120 days) |
| Design outdoor temperature | -19°C |
| Indoor design temperature | 18°C |
| Primary supply temperature | 95-110°C |
| Primary return temperature | 65-75°C |
| Primary differential pressure | 0.8-1.2 MPa |
| Connected floor area | 1.44 million m² |
| Annual heat consumption | ~1.85 PJ |
7. Frequently Asked Questions
Q: How accurate is clamp-on ultrasonic flow measurement compared to in-line meters? A: Modern clamp-on ultrasonic flow meters like the LONN-UFM achieve accuracy of ±2.0% of reading under ideal installation conditions — comparing favorably with mechanical turbine meters (±3-5% typical for aged meters). The accuracy depends on correct pipe surface preparation, proper transducer spacing, and knowledge of the pipe wall thickness and material. The LONN-UFM’s built-in signal strength indicator and signal-to-noise ratio display help the installer confirm correct installation before commissioning.
Q: Does water quality affect ultrasonic flow measurement? A: Ultrasonic flow measurement is insensitive to water conductivity (unlike electromagnetic meters) and is minimally affected by suspended solids at concentrations typical of district heating systems. The water in this network is treated to maintain pH 8.5-9.5, which minimizes corrosion product accumulation. The LONN-UFM’s dual-path measurement (transmitting in both upstream and downstream directions simultaneously) provides inherent cancellation of flow profile distortions and particulate interference.
Q: How does the meter handle air bubbles or partial pipe filling? A: The LONN-UFM incorporates air bubble detection via an amplitude variation algorithm. When air bubbles are detected, the meter flags the measurement as potentially erroneous and does not include the affected data in the cumulative total. In this district heating network, the closed-loop circulation system and expansion tank design minimize air entrainment under normal operation. Occasional air accumulation during filling and venting is managed by scheduling meter data exclusion during these planned operations.
Q: What is the expected lifespan of the clamp-on transducer assembly? A: The transducer elements themselves have no wear mechanism and are expected to last the life of the installation (10+ years). The primary maintenance item is the acoustic couplant — a thermal compound that fills the air gap between the transducer and the pipe surface. In heating applications, thermal cycling can cause the couplant to degrade over 2-3 years. The LONN-UFM transducer assembly includes a re-usable couplant pad that can be inspected and re-applied annually.
Q: Can the meter be installed on buried or insulated pipes? A: For buried pipes, the transducer must be installed on an exposed section (at a valve pit or access point) where the pipe surface can be accessed for transducer mounting. For insulated pipes, the insulation must be temporarily removed at the measurement point, the transducer installed, and the insulation replaced around the transducer assembly. The LONN-UFM’s IP65 transmitter housing can be mounted on the pipe surface or on a nearby wall bracket, with signal cables routed through the insulation to the transducer assembly.
8. Conclusion
The deployment of LONNMETER ultrasonic flow meters across this Liaoning district heating network demonstrates that clamp-on ultrasonic flow measurement is a practical and cost-effective solution for closed-loop heating network monitoring — enabling accuracy verification and anomaly detection without pipe cutting or service interruption.
The results are clear: a 28% reduction in unaccounted energy loss, zero flow meter maintenance events in the first heating season, and a payback period of less than 6 months. The most valuable capability was not captured in the financial figures: the real-time visibility into network performance that enabled rapid detection and correction of three operational issues that would have gone undetected for weeks under the previous manual reading schedule.
For any district heating utility facing unaccounted energy loss, aging meter fleets, or limited maintenance windows, the case for clamp-on ultrasonic flow measurement is compelling — both in terms of direct financial return and in improved network operational awareness.
Request a Quote
To discuss district heating flow measurement solutions for your heating network, LONNMETER offers process-specific technical consultation and network survey services.
Contact: anna@xalonn.com
Products referenced: LONN-UFM Clamp-on Ultrasonic Flow Meter
Related Case Study: CNG Flow Measurement — Gas Station Network