Introduction
Two technologies dominate the non-nuclear inline density measurement market: tuning fork vibration and ultrasonic acoustic impedance. Both deliver continuous, real-time density data, but they arrive at the answer through completely different physical principles — and that difference dictates where each technology wins and where it fails.
A chemical engineer selecting a sensor for a clean sulfuric acid line cares about very different things than a metallurgist measuring slurry at 40% solids by weight. The chemist needs ±0.002 g/cm³ accuracy for mass balance and concentration control. The metallurgist needs a sensor that survives abrasive particles and never clogs. Matching the wrong technology to the application costs months of troubleshooting and tens of thousands of dollars in lost product.
This guide delivers a complete, engineer-to-engineer tuning fork vs ultrasonic density meter comparison. You’ll get the physics, the practical performance data, a head-to-head table, and a decision framework used by LONNMETER field engineers across chemical, petroleum, mining, and food & beverage installations worldwide. Engineers evaluating the tuning fork vs ultrasonic density meter decision will find the decision framework in section 6 directly applicable to their selection process.
How Each Technology Works
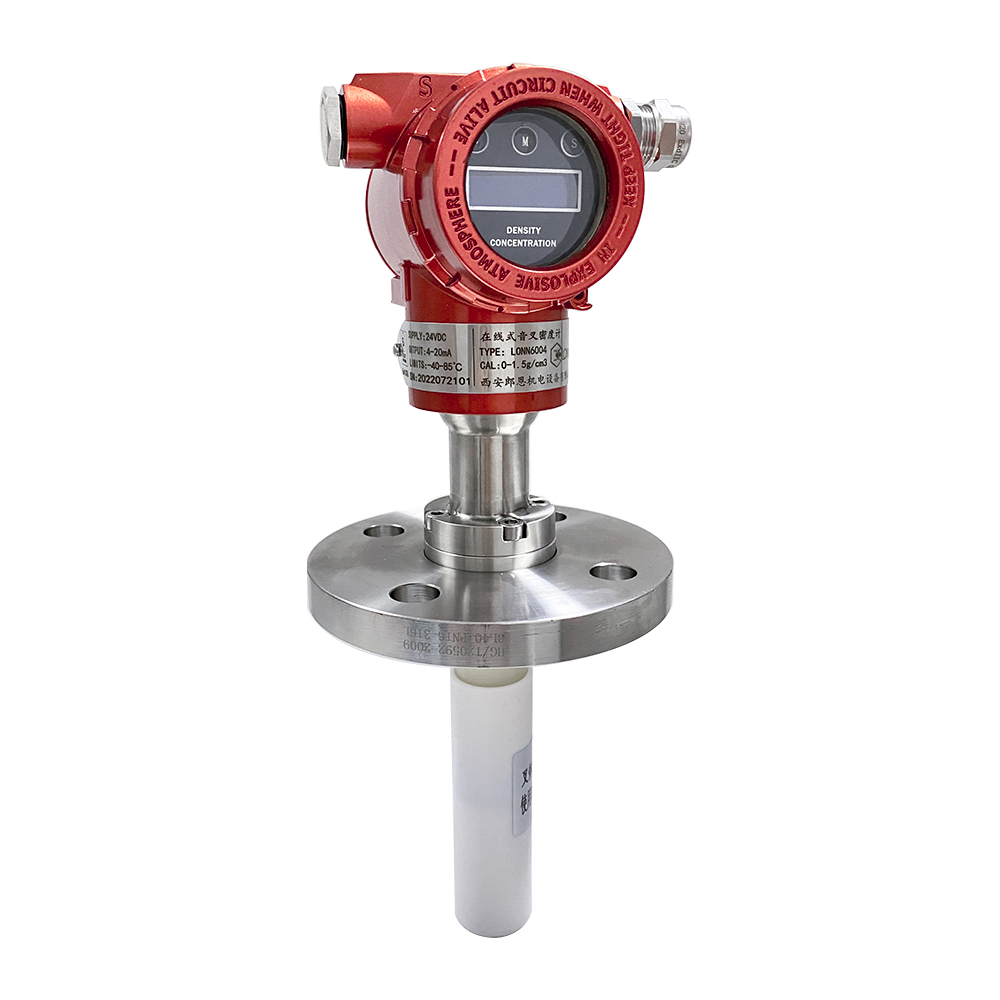
Tuning Fork Density Measurement Principle
A pair of metal tines (the “tuning fork”) is inserted into the process fluid and excited at its natural resonant frequency by a piezoelectric actuator. The resonant frequency decreases as the surrounding fluid density increases — heavier fluid dampens the vibration more than lighter fluid. By measuring the resonant frequency shift with sub-Hertz resolution, the instrument calculates fluid density in real time.
The relationship between frequency shift and density is highly linear over the operating range, and the same instrument can simultaneously derive viscosity from the damping of the oscillation amplitude — making tuning fork sensors uniquely capable of dual-parameter measurement in a single device.
Key physical characteristics:
- Sensor wetted by the process fluid (tines immersed in the flow)
- Frequency shift typically 1,500 Hz to 2,500 Hz across 0.5–2.5 g/cm³
- Accuracy ±0.001 to ±0.002 g/cm³ depending on calibration
- Response time 1 second or faster
- Minimum measurable density ~0.5 g/cm³; maximum ~2.5 g/cm³ (clean fluids)
Ultrasonic Density Measurement Principle
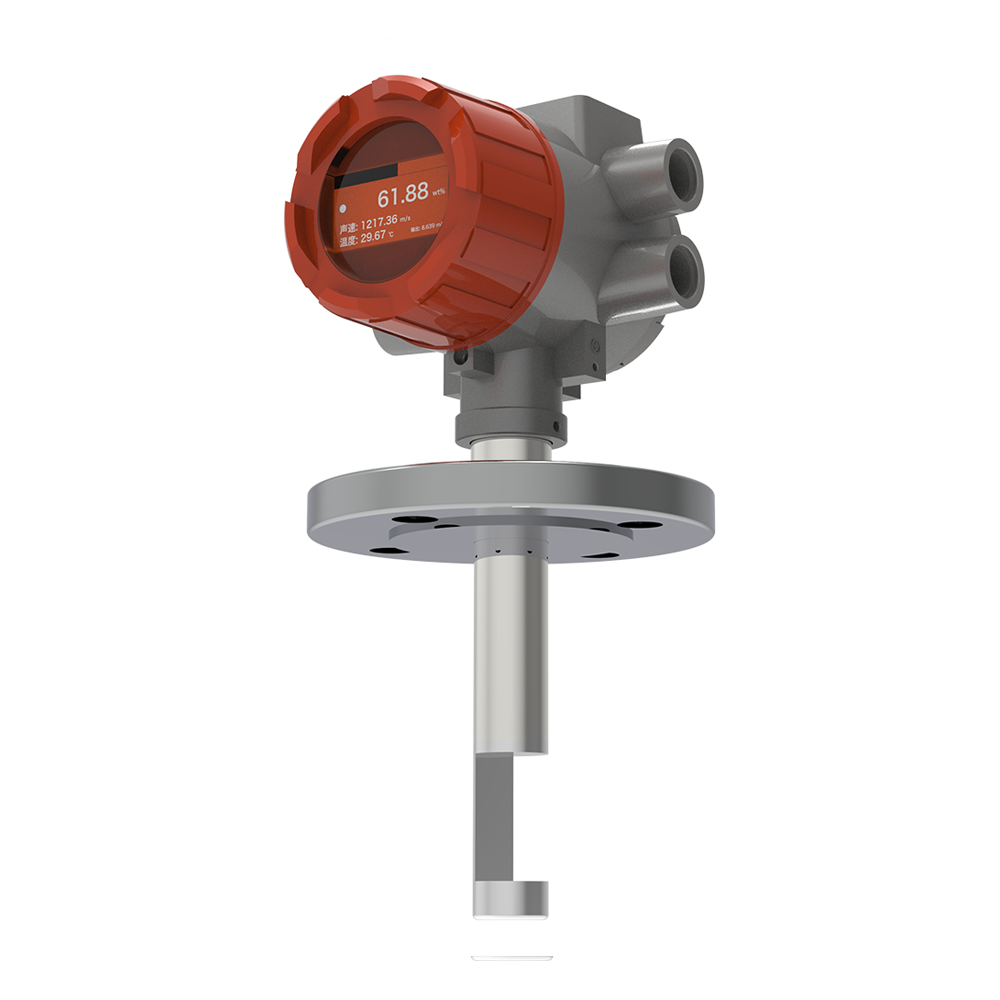
An ultrasonic density meter uses a pair of piezoelectric transducers mounted on opposite sides of the pipe (or one transducer and a reflector). One transducer emits an ultrasonic pulse; the pulse travels through the fluid to the receiving transducer. The pulse transit time, attenuation, and acoustic impedance of the fluid all vary with density.
The acoustic impedance (Z = ρ × c, where ρ is density and c is the speed of sound in the fluid) provides a robust density proxy for many process fluids. Because the ultrasonic signal passes through the fluid without physical contact, the sensor is non-intrusive — the wetted surface is essentially the inside of the pipe, not a sensor element protruding into the flow.
Key physical characteristics:
- Non-intrusive: transducers clamp to outside of pipe or mount in a section with windows
- Acoustic impedance measurement independent of fluid color, opacity, or conductivity
- Accuracy ±1% of reading typical; ±0.005 g/cm³ achievable with calibration
- Response time 1 second or faster
- Suitable for slurries up to 40% suspended solids and particles up to several millimeters
Head-to-Head Comparison
| Parameter | Tuning Fork Density Meter | Ultrasonic Density Meter |
|---|---|---|
| Measurement principle | Resonant frequency shift of immersed tines | Acoustic impedance / transit time of ultrasonic pulse |
| Wetted components | Tines (sensor element in flow) | Pipe wall only (clamp-on) or pipe with acoustic windows |
| Typical accuracy | ±0.001 to ±0.002 g/cm³ | ±1% of reading (±0.005 g/cm³) |
| Repeatability | ±0.0005 g/cm³ | ±0.5% of reading |
| Range | 0.5–2.5 g/cm³ (clean fluids) | 0.5–3.5 g/cm³ (any fluid) |
| Response time | ≤1 second | ≤1 second |
| Maximum solids tolerance | 5–10% suspended solids (standard); up to 40% (ceramic version) | 40% suspended solids; particles up to 5 mm |
| Maximum particle size | 50 μm (ceramic tines: 200 μm with derating) | 5 mm typical; some models to 10 mm |
| Viscosity range | 0.5–50,000 cP (also measures viscosity) | 1–10,000 cP (density only) |
| Hygienic / sanitary | Possible (3-A with special design) | Excellent (no protrusion, easy CIP) |
| CIP / SIP compatibility | Limited (tines must be cleaned) | Excellent (no obstruction) |
| Temperature range | –40°C to +150°C (standard); +200°C (high-temp) | –40°C to +200°C |
| Pressure range | Up to 100 bar | Up to 40 bar (clamp-on: pipe pressure rating) |
| Materials of construction | 316L SS, Hastelloy C-276, ceramic-tined variants | Pipe material (no wetted sensor) |
| Calibration stability | Excellent (no drift with clean fluids) | Excellent (acoustic property stable) |
| Cost (instrument only) | $4,500 – $9,000 USD | $5,500 – $11,000 USD |
| Installation cost | Moderate (flange mounting, by-pass optional) | Low–Moderate (clamp-on) to High (inline section) |
| Maintenance burden | Low–Moderate (cleaning of tines in fouling service) | Very Low (no wetted sensor to clean) |
| Best-fit applications | Custody transfer, clean liquids, concentration control, viscosity measurement | Slurries, hygienic service, non-contact requirement, large pipe diameters |
Where the Tuning Fork Density Meter Wins
1. Custody Transfer and High-Accuracy Applications
Tuning fork density meters achieve ±0.001 g/cm³ accuracy when properly calibrated against reference standards traceable to NIST. This level of precision is sufficient for custody transfer in many chemical and petroleum services, particularly when paired with a Coriolis flow meter for mass flow measurement.
For pharmaceutical, food, and specialty chemical applications where every 0.001 g/cm³ affects product quality, tuning fork technology is the only practical non-nuclear option with sufficient resolution.
2. Concentration Control of Clean Liquids
In acid, base, and solvent concentration monitoring, the linear relationship between tuning fork frequency shift and density delivers ±0.2% concentration accuracy over a 0–100% concentration range when temperature-compensated. This is critical in:
- Sulfuric acid dilution and concentration (92–98% H₂SO₄ control)
- Sodium hydroxide strength monitoring (10–50% NaOH)
- Hydrochloric acid pickling bath control
- Ethanol, methanol, and isopropanol concentration in solvent recovery
The LONN-700CM inline tuning fork density meter delivers ±0.002 g/cm³ accuracy with 4-20mA and RS485 Modbus outputs, suitable for custody transfer and tight concentration control.
3. Combined Density + Viscosity Measurement
Tuning fork sensors uniquely provide both density and dynamic viscosity from a single mechanical element. The frequency shift correlates to density; the amplitude damping correlates to viscosity. For paint, coating, adhesive, and polymer applications where both properties matter, this dual capability eliminates the need for a separate viscometer — saving $4,000–$8,000 in instrument cost.
4. High-Pressure Service
Tuning fork sensors with proper flange mounting handle process pressures up to 100 bar (and higher on special designs). Ultrasonic clamp-on sensors depend on the pipe’s pressure rating and acoustic coupling, which becomes problematic above 25–40 bar in most installations.
Where the Ultrasonic Density Meter Wins
1. Abrasive Slurry Service
This is the single largest advantage of ultrasonic density measurement. In mining (copper, iron ore, coal), mineral processing (flotation feed, tailings), and dredging applications, slurries contain abrasive particles that destroy tuning fork tines within weeks to months.
Ultrasonic sensors have no wetted sensor element — the transducers are bonded to the outside of the pipe or mounted on a spool piece with acoustic windows. There is nothing to wear, erode, or replace. The LONN7000 ultrasonic density meter handles slurries with up to 40% suspended solids and particles up to several millimeters in diameter.
Field experience from a copper concentrator in South America: ultrasonic density meters installed in 2022 are still operating on their original transducers as of 2026, with zero sensor-related downtime. Comparable tuning fork installations on the same service required ceramic tine replacement every 4–6 months.
2. Hygienic and Sanitary Applications
In food, beverage, dairy, and pharmaceutical applications, 3-A Sanitary and EHEDG certification require:
- No dead legs or product retention zones
- Smooth, drainable surfaces
- CIP (Clean-In-Place) compatibility at 80–95°C with caustic and acid cleaning solutions
An ultrasonic sensor mounted in a sanitary spool piece with no protrusion into the flow path meets all three requirements. A tuning fork sensor with tines immersed in the flow creates a small retention zone behind each tine and requires manual cleaning verification.
The LONN7000 ultrasonic sensor’s smooth, unobstructed flow path minimizes product retention zones and bacterial growth sites, making it suitable for sanitary applications including dairy, beverage, and pharmaceutical processing.
3. Non-Contact and Retrofit Installations
Clamp-on ultrasonic sensors attach to the outside of existing piping without process interruption. This is invaluable for:
- Retrofits on existing pipelines where shutdown is expensive
- Verification of installed Coriolis or differential pressure flow meters
- Temporary measurements for process troubleshooting or capacity studies
Tuning fork sensors require flange mounting and process shutdown for installation, making them unsuitable for retrofit applications on critical service lines.
4. Large Pipe Diameters (>DN150)
For pipes larger than DN150 (6-inch), tuning fork sensors become mechanically impractical — the tines must be large enough to generate measurable frequency shift, making them fragile and expensive. Ultrasonic sensors scale gracefully with pipe diameter because the acoustic path length is naturally larger, providing better measurement resolution.
Where Each Technology Struggles
Tuning Fork Limitations
- Solids above 5–10%: Particles lodge between tines, causing measurement drift and requiring frequent cleaning. Ceramic-tined variants extend tolerance to 40% solids but at 3–5× the cost.
- Fibrous or stringy fluids: Pulp, paper stock, and food products with fibers can wrap around tines and stall oscillation.
- Very low viscosity (<0.5 cP): Light hydrocarbons and solvents at high temperature provide insufficient damping for stable frequency measurement.
Ultrasonic Limitations
- Air bubbles: Entrained gas disrupts ultrasonic transmission. Stilling chambers or bubble-tolerant algorithms are required for carbonated beverages, fermenters, and aerated processes.
- Acoustic coupling changes: Deposition on the inner pipe wall (scale, fouling) changes the acoustic coupling and causes calibration drift. Periodic cleaning of the inner pipe wall is required in fouling service.
- Lower absolute accuracy: ±1% of reading is insufficient for custody transfer of high-value products where ±0.1% mass balance is required. This is the central trade-off in any tuning fork vs ultrasonic density meter selection.
- Two-component fluids: The acoustic impedance correlates with density but only if the speed of sound in the fluid is constant. In emulsions or two-phase mixtures, the speed of sound varies independently of density, introducing measurement error. When evaluating tuning fork vs ultrasonic density meter options for emulsion service, prefer tuning fork for its direct mass-loading measurement.
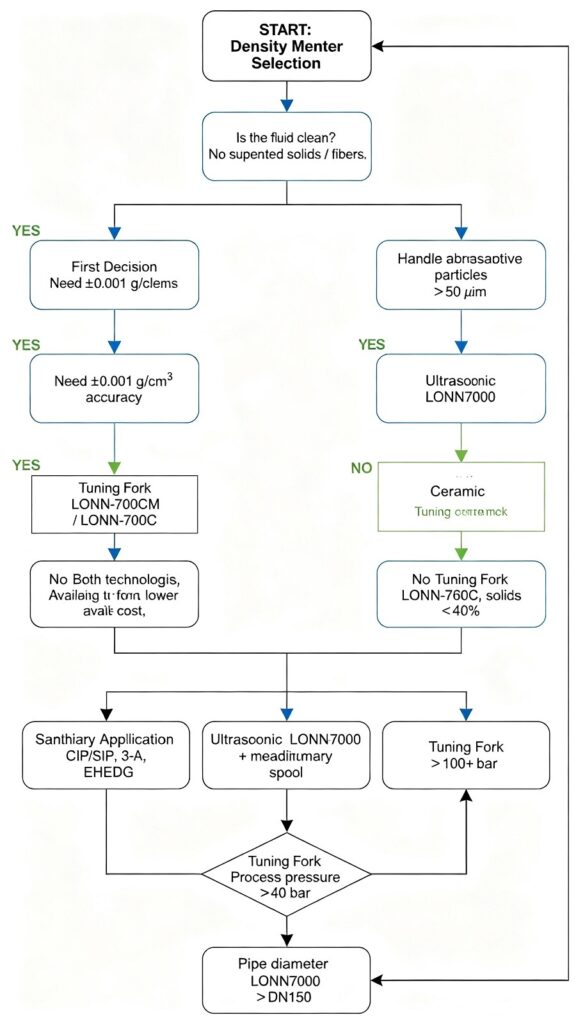
Decision Framework
Use this decision tree to select the correct technology for your application:
LONNMETER Product Recommendations
| Application | Recommended Technology | Recommended Model | Key Feature |
|---|---|---|---|
| Custody transfer of clean liquids | Tuning Fork | LONN-700CM | ±0.002 g/cm³, 4-20mA + Modbus |
| Acid/base/solvent concentration | Tuning Fork | LONN-700CM | ±0.2% concentration with TC |
| Mining slurry (>10% solids) | Ultrasonic | LONN7000 | Up to 40% solids, 5 mm particles |
| Hygienic food/dairy/pharma | Ultrasonic | LONN7000 (sanitary) | 3-A compliant, CIP compatible |
| Abrasive slurry with small particles | Ceramic Tuning Fork | LONN-700C | ±0.002 g/cm³, ceramic tines, 1200 HV |
| Combined density + viscosity | Tuning Fork | LONN-V7 | Dual-parameter from single sensor |
| Retrofit without shutdown | Ultrasonic (clamp-on) | LONN-UFM | Non-intrusive installation |
All LONNMETER instruments use non-radioactive measurement principles, eliminating the special licensing, periodic source leak testing, and decommissioning procedures required for radiometric density measurement. Our instruments are certified to ATEX, IECEx, and ISO standards, and are supported by global distribution across 130+ countries.
Frequently Asked Questions
Q1: Which is more accurate between tuning fork vs ultrasonic density meter?
Tuning fork density meters are inherently more accurate, achieving ±0.001 to ±0.002 g/cm³ versus ±1% of reading (±0.005 g/cm³ or more) for ultrasonic sensors. The reason is physical: the tuning fork’s resonant frequency can be measured with sub-Hertz resolution, providing direct density correlation; ultrasonic sensors rely on secondary acoustic properties that vary with temperature, composition, and entrained gas.
For applications requiring better than ±0.005 g/cm³ — custody transfer, pharmaceutical quality control, precision blending — tuning fork is the correct choice. For applications where ±1% of reading is acceptable — slurry density monitoring, general process control — ultrasonic provides adequate accuracy at lower cost and with dramatically better solids tolerance.
Q2: Can ultrasonic density meters in a tuning fork vs ultrasonic comparison handle slurries?
Yes. This is the primary advantage of ultrasonic technology. Ultrasonic density meters handle slurries with up to 40% suspended solids by weight and particles up to 5–10 mm in diameter, depending on the model. The non-intrusive design means there is no sensor element exposed to abrasion. In mining (copper, iron ore, coal), mineral processing (flotation feed, tailings), and dredging applications, ultrasonic density meters deliver reliable measurement where tuning fork sensors fail within weeks to months.
The LONN7000 ultrasonic density meter handles slurries with up to 40% suspended solids and particles up to several millimeters in diameter. Field installations in copper concentrators, coal preparation plants, and mineral processing facilities confirm 4+ year service life with no sensor replacement.
Q3: In a tuning fork vs ultrasonic density meter selection, which is easier to clean?
In clean fluid service (chemicals, solvents, oils), tuning fork sensors require minimal maintenance — typically annual visual inspection and verification of calibration against a reference standard. In fouling or scaling fluids (lime slurry, polymer solutions, sugar syrups), periodic cleaning of the tines is required to prevent measurement drift.
Best practice is to install the tuning fork in a by-pass loop with isolation valves, allowing sensor removal without process shutdown for cleaning and verification. Cleaning frequency varies from monthly (high-fouling service) to annually (clean service).
Q4: Can one density meter measure both density and viscosity?
Tuning fork density meters can measure both density and viscosity simultaneously from the same sensor element. The resonant frequency shift correlates to density; the amplitude damping correlates to viscosity. This dual-parameter capability eliminates the need for a separate viscometer in applications like paint, coating, adhesive, and polymer manufacturing.
The LONN-V7 inline viscosity and density meter delivers both parameters from a single sensor with 4-20mA and Modbus outputs, suitable for coating, adhesive, and polymer process control. Ultrasonic density meters measure density only — a separate viscometer is required for viscosity measurement in processes that need both.
Q5: In a tuning fork vs ultrasonic density meter comparison, what is the cost difference?
Tuning fork density meters typically cost $4,500 to $9,000 USD for the instrument alone; ultrasonic density meters cost $5,500 to $11,000 USD. Installation costs vary widely — tuning fork requires flange mounting and process shutdown (higher cost for retrofit), while ultrasonic clamp-on models install without shutdown (lower cost for retrofit, but limited to lower-pressure service).
Total installed cost comparison must include:
- Instrument cost
- Installation labor and process interruption (for inline) or none (for clamp-on)
- Calibration and commissioning
- Lifetime maintenance (tuning fork: tine replacement every 2–5 years in abrasive service; ultrasonic: no sensor replacement)
- Process-specific accessories (by-pass loop, sanitary spool, calibration standards)
For high-accuracy clean-fluid applications, tuning fork delivers lower total cost over 10 years. For slurry and hygienic applications, ultrasonic delivers dramatically lower maintenance cost and higher availability.
Q6: Are ultrasonic density meters affected by air bubbles?
Yes — entrained air or gas bubbles disrupt ultrasonic transmission and cause measurement error or signal loss. Stilling chambers, bubble-tolerant algorithms, and careful installation orientation (upward flow with vertical pipe to allow bubble escape) mitigate this issue.
In carbonated beverages, fermenters, and aerated processes, ultrasonic density measurement requires either a stilling chamber (adds 10–30 seconds to response time) or specialized bubble-tolerant firmware. Tuning fork density meters are less affected by small bubbles because the tuning fork’s mechanical resonance is dominated by the surrounding liquid mass; small bubbles may cause minor transient error but do not interrupt measurement.
For aerated or bubble-containing fluids, tuning fork or Coriolis measurement is generally preferred over ultrasonic.
Q7: In a tuning fork vs ultrasonic density meter comparison, which is better for custody transfer?
Tuning fork density meters are preferred for custody transfer of clean liquids because they provide ±0.001 to ±0.002 g/cm³ accuracy, which is traceable to national metrology standards through calibration against certified reference fluids. For petroleum custody transfer in pipelines larger than DN150, Coriolis meters (which provide both mass flow and density) are the standard choice. When the tuning fork vs ultrasonic density meter decision must support custody-grade accuracy, tuning fork is the clear winner.
Ultrasonic density meters are not typically used for custody transfer because their ±1% accuracy is insufficient for high-value product measurement where even small errors translate to significant financial exposure. Ultrasonic is preferred for process monitoring where the absolute accuracy requirement is lower.
Conclusion
The tuning fork vs ultrasonic density meter decision comes down to application matching, not technology superiority. Selecting between a tuning fork vs ultrasonic density meter is one of the most common instrumentation decisions in chemical, mining, and food process plants — and one of the most expensive when made incorrectly. Tuning fork delivers unmatched accuracy for clean fluids and dual-parameter density-viscosity measurement. Ultrasonic delivers unmatched solids tolerance, hygienic compatibility, and non-intrusive installation.
The wrong choice is expensive in both directions: a tuning fork in abrasive slurry service wears out in months; an ultrasonic in custody transfer of high-value chemicals introduces unacceptable measurement error. Match the technology to the application, and verify the selection with a LONNMETER field engineer who has installed both technologies in your specific industry.
For specific application guidance, request a consultation with our engineering team — provide your fluid type, particle size distribution, concentration range, accuracy requirement, and pipe size, and we will recommend the correct technology and model with documented field performance in similar applications.
- Browse the full LONNMETER inline density meter product range
- Contact our technical team for application-specific recommendations
For related comparisons, see our guides on density meter selection guide and how to choose the right density meter.
About LONNMETER: LONNMETER manufactures both tuning fork (LONN-700CM, LONN-700C) and ultrasonic (LONN7000) inline density meters, certified to ATEX, IECEx, and ISO 9001 standards. Our recommendations are based on genuine technical fit, not a single product line’s limitations. Global distribution across 130+ countries; technical support in 12 languages.