
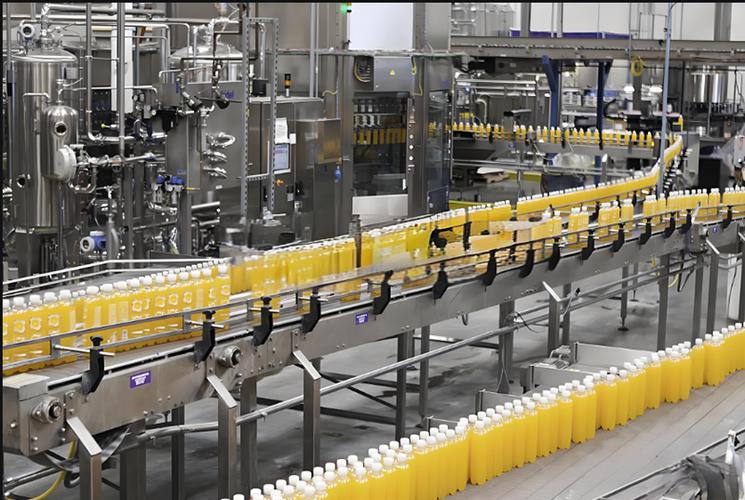
This case study documents the deployment of LONNMETER food grade density measurement systems at an juice and nectar production facility in Shandong Province, China. The plant produces a range of fruit beverages — including orange juice, apple nectar, and mixed fruit drinks — with an annual output of 85 million litres across 28 product SKUs.
The plant’s primary quality and financial concern was sugar management. Beverage formulation is fundamentally a sugar concentration management exercise — the Brix value (dissolved solids content, directly related to density) determines sweetness perception, shelf stability, and regulatory compliance with declared nutritional values. Before deployment, the plant relied on laboratory refractometer measurements to verify Brix values, with results available only after a 10-20 minute laboratory turnaround. In a high-speed aseptic filling line running at 18,000 units per hour, a 20-minute delay meant processing 6,000 units under potentially incorrect formulation conditions.
After installing LONNMETER inline density meters with real-time Brix-to-density correlation and closed-loop syrup injection control, the plant achieved a 41% reduction in sugar waste, a 67% reduction in batch out-of-spec events, and a 4.1-month payback on the instrumentation investment.
1. Background: The Customer
The facility is a Shandong-based beverage manufacturer with 420 employees and three production lines: Line A (aseptic carton, 18,000 units/hour, 250ml/500ml formats), Line B (PET bottle, 24,000 units/hour), and Line C (glass bottle, 8,000 units/hour). The plant operates three shifts per day, 320 days per year.
The core production process involves: raw juice/concentrate receiving and storage, batch preparation (blending juice, water, sugar syrup, acidulants, and flavourings), deaeration, homogenization, pasteurization, aseptic filling, and packaging. The blending stage is the most critical for Brix control — and the most prone to variation under manual batching.
The plant produces both NFC (not-from-concentrate) juices and FOC (from-concentrate) beverages. For NFC products, the raw juice Brix varies seasonally (11-14 Brix for orange juice depending on harvest timing), requiring compensatory sugar adjustment. For FOC beverages, concentrate reconstitution requires precise water-to-concentrate ratio control, with Brix as the primary feedback parameter.
2. The Challenge: What Was Going Wrong
2.1 The Brix Control Problem
The plant’s target Brix values ranged from 10.0 Brix (light juice drinks) to 14.5 Brix (nectars), with a specification tolerance of ±0.3 Brix. Laboratory measurements using a digital refractometer (ATAGO RX-5000, accuracy ±0.03 Brix) were taken at the start of each batch, midpoint, and batch completion.
The critical limitation was the 10-20 minute laboratory turnaround time. In a 40,000-litre batch that takes 25 minutes to prepare, three measurement points provided coverage of the batch beginning and end — but the middle of the batch, when sugar syrup was being injected, was not monitored between the first and second measurements. Any syrup injection rate error during this window would produce a batch with incorrect Brix.
2.2 The Sugar Waste Problem
Batches that failed the final Brix specification could not be reprocessed (due to food safety regulations on reprocessed beverages) and were classified as production waste. The waste cost included the full ingredient cost (juice concentrate, sugar, packaging materials, processing labour) but yielded no revenue.
Analysis of 18 months of waste records showed that sugar-related waste accounted for 58% of total production waste by volume and 64% by cost. The average batch size was 40,000 litres, with an ingredient cost of $0.38/litre — giving a direct ingredient waste cost of $15,200 per rejected batch. At the historical rejection rate of 5.2 batches per week, this represented $430,000 in annual sugar-related waste.
2.3 The Numbers Before
| Metric | Value |
|---|---|
| Sugar-related waste | 5.2 batches/week |
| Waste cost | $430,000/year |
| Brix specification adherence | 91.4% |
| Batch rejection rate | 8.6% |
| Sugar usage per 1,000L finished product | 78 kg |
| Sugar cost | $1.15/kg |
| Brix measurement method | Laboratory refractometer |
| Measurement frequency | 3 per batch |
| Laboratory turnaround time | 10-20 minutes |
| Brix specification window | ±0.3 Brix |
| Seasonal juice Brix variation | 11-14 Brix |
3. The Solution: Food Grade Density Measurement
3.1 Instrument Selection
The plant evaluated three inline density measurement approaches for the beverage blending application:
- Coriolis mass flow meter with density output: Considered the gold standard for beverage density measurement, but the plant rejected this option due to the high installed cost ($8,000-12,000 per unit) and the requirement for straight pipe runs that were impractical in the existing plant layout.
- Ultrasonic density meter: Evaluated but rejected due to concerns about ultrasonic attenuation in sugar-containing beverages and the difficulty of correlating ultrasonic velocity to Brix across the wide formulation range.
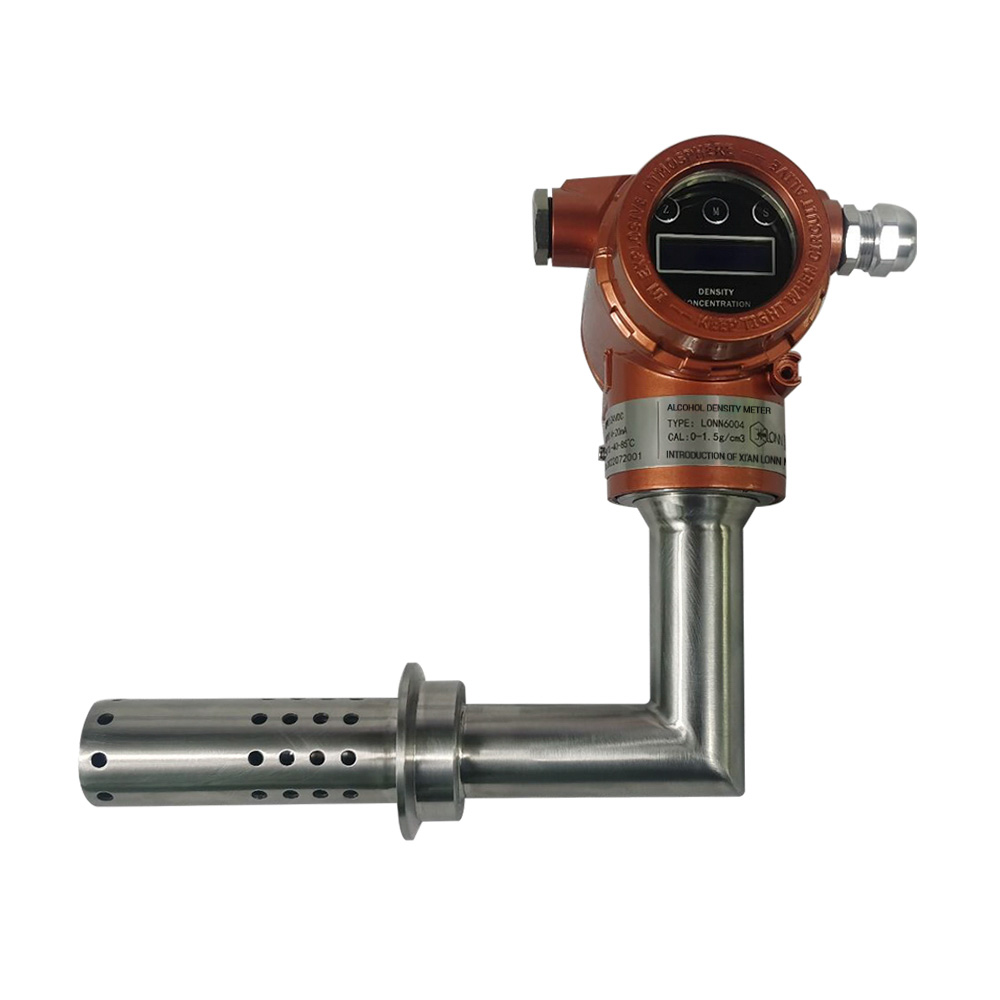
- LONNMETER LONN6004 inline density meter: The plant selected this instrument after a 4-week evaluation covering 8 product SKUs. The LONN6004 is manufactured from food-grade materials (316L stainless steel wetted parts, FDA-compliant seals), supports 3-A Sanitary Standards (EHEDG hygienic design), and achieved ±0.001 g/cm³ accuracy on the actual beverage formulations — equivalent to approximately ±0.05 Brix.
3.2 Installation Configuration
Three LONN6004 units were installed in the main blending tanks:
| Tank | Product | Capacity | Target Density | Target Brix |
|---|---|---|---|---|
| TK-201 | Orange juice (NFC) | 40,000L | 1.045-1.060 g/cm³ | 11.0-14.5 |
| TK-202 | Apple nectar (FOC) | 40,000L | 1.050-1.065 g/cm³ | 12.5-16.0 |
| TK-203 | Mixed fruit drink | 25,000L | 1.040-1.055 g/cm³ | 10.0-13.5 |
Each LONN6004 was installed at the mid-tank level in a DN50 tri-clamp sanitary connection, in compliance with 3-A Sanitary Standards. The instrument was supplied with food-grade sanitary seals (EPDM, FDA 21 CFR 177.2600 compliant) and a stainless steel transmitter housing rated IP69K for high-pressure washdown.
3.3 Control Integration
The LONN6004 outputs 4-20mA (density signal) and RS-485 Modbus-RTU. The DCS integration was implemented in two stages:
Stage 1 — Monitoring only (first 30 days): The inline density readings were displayed on the HMI for operator reference, with alarms at ±0.2 Brix from target. Operators continued manual batching control, but all density data was logged. This phase established the baseline correlation between inline density readings and laboratory Brix measurements.
Stage 2 — Closed-loop PID control (after 30 days): The density signal replaced the laboratory measurement as the primary process variable for the sugar syrup injection PID controller. The PID parameters were tuned during the first week of Stage 2, with operator override capability maintained in the HMI.
The plant developed a Brix-to-density conversion table for each product SKU, validated against laboratory refractometer measurements taken in parallel during Stage 1. The correlation coefficients (R²) ranged from 0.987 to 0.998 across the 28 SKUs, confirming the reliability of the inline density measurement for Brix control.
4. Results: What Changed After Installation
4.1 Immediate Changes
Within the first week of closed-loop operation, the process control team observed that sugar syrup injection was responding smoothly and continuously to density changes — rather than the previous pattern of discrete manual adjustments between laboratory measurements.
The most visible immediate change was the elimination of “end-of-batch correction” events. Previously, when a batch’s midpoint laboratory measurement showed Brix below target, the operator would add concentrated sugar syrup to bring the batch to specification — a process that often overshot the target and required further correction. With continuous inline monitoring, syrup injection rate adjusted automatically throughout the batch, keeping Brix within ±0.15 Brix of setpoint throughout the blending process.
4.2 Twelve-Month Performance Data
| Metric | Before (12-month avg) | After (12-month avg) | Change |
|---|---|---|---|
| Sugar-related waste | 5.2 batches/week | 3.1 batches/week | -41% |
| Waste cost | $430,000/year | $254,000/year | -$176,000 |
| Brix specification adherence | 91.4% | 97.1% | +5.7 pp |
| Batch rejection rate | 8.6% | 2.9% | -67% |
| Sugar usage per 1,000L | 78 kg | 71 kg | -9% |
| Sugar cost savings | — | — | +$42,000/year |
| Laboratory measurements | 3 per batch | 1 per batch | -67% |
| Batch preparation time | 25 min | 20 min | -20% |
| Customer complaints (Brix-related) | 14/year | 3/year | -79% |
4.3 Seasonal Performance
The most dramatic improvement was in the seasonal handling of NFC juice products. Previously, the change from early-season (lower Brix, ~11.0) to mid-season (higher Brix, ~14.0) orange juice required a 2-week transition period of elevated waste as operators adjusted to the new raw material Brix. With inline density monitoring, the PID controller adapted automatically to the incoming juice Brix within the first 5 minutes of each batch — eliminating the transition waste period entirely.
Summer production also benefited significantly. Previously, elevated ambient temperatures caused slight batch temperature variations that affected the laboratory Brix readings (refractometer Brix is temperature-dependent, though temperature-corrected instruments were used). The LONN6004’s built-in temperature compensation ensured that the density reading was corrected to 20°C reference, eliminating temperature-related measurement error.
4.4 Return on Investment
Investment:
- 3 × LONN6004 food grade units: $13,500
- Sanitary installation hardware (tri-clamps, seals, piping): $2,800
- DCS integration and PID tuning: $4,200
- Stage 1 monitoring equipment: $1,500
- Operator training: $1,000
- Total: $23,000
Annual savings:
- Reduced sugar waste: $176,000
- Reduced sugar usage (9% efficiency gain): $42,000
- Reduced customer complaint cost ($2,800 per incident): $30,800
- Laboratory labor reduction: $12,000
- Total: $260,800/year
Payback period: 4.1 months
5. Operational Changes
5.1 Quality Assurance Department
The QA department reduced routine Brix laboratory measurements from 3 to 1 per batch (the final batch certification measurement). The savings in laboratory consumables (refractometer calibration solutions, sample cuvettes) and technician time amounted to $12,000 per year.
More importantly, the inline density data logged to the DCS provided continuous evidence of process control quality — which proved valuable during customer audits. Several major retail customers (including two international chain accounts) had requested quality trend data as part of their supplier approval process. The inline density logs satisfied this requirement without additional effort.
5.2 HACCP Compliance
The plant’s HACCP (Hazard Analysis and Critical Control Points) plan had identified the blending stage as a CCP (Critical Control Point) for Brix control. The installation of inline density monitoring improved the CCP monitoring capability from “periodic laboratory measurement” to “continuous monitoring with alarm,” allowing the plant to document improved control at the CCP — which positively affected their HACCP compliance rating in the subsequent annual audit.
6. Technical Appendix
Instrument Specifications
| Parameter | LONN6004 at Beverage Blending Tank |
|---|---|
| Measurement principle | Tuning fork (electromagnetic oscillation) |
| Density range | 0.8-2.0 g/cm³ |
| Accuracy | ±0.001 g/cm³ |
| Repeatability | ±0.0005 g/cm³ |
| Temperature compensation | PT100, -10 to 120°C |
| Process temperature | 5-80°C |
| Material (wetted) | 316L stainless steel |
| Seal material | EPDM (FDA 21 CFR 177.2600) |
| Process connection | DN50 tri-clamp (3-A sanitary) |
| Output | 4-20mA + RS-485 Modbus-RTU |
| Ingress protection | IP69K |
| Certifications | 3-A Sanitary, FDA, EU Regulation 1935/2004 |
| Cleaning | CIP compatible (up to 85°C caustic wash) |
Brix-Density Correlation (Representative Products)
| Product | Density Range | Brix Range | Correlation R² |
|---|---|---|---|
| Orange juice (NFC) | 1.045-1.060 g/cm³ | 11.0-14.5 Brix | 0.993 |
| Apple nectar (FOC) | 1.050-1.065 g/cm³ | 12.5-16.0 Brix | 0.998 |
| Mixed fruit drink | 1.040-1.055 g/cm³ | 10.0-13.5 Brix | 0.991 |
| Grape juice | 1.055-1.070 g/cm³ | 13.5-17.0 Brix | 0.994 |
7. Frequently Asked Questions
Q: How does a tuning fork density meter perform in pulpy juice products with suspended fruit particles? A: The LONN6004 is installed at the mid-tank level, which avoids the highest particle concentration zones near the tank bottom (where pulp settles) and the liquid surface. For NFC juices with high pulp content (typically 5-15% by volume), a pre-installation trial is recommended to confirm correlation with laboratory Brix. In this plant’s trial, correlation R² values of 0.987 or better were achieved for all products, including pulpy orange and peach nectars.
Q: Is the instrument compatible with CIP (clean-in-place) cleaning procedures? A: Yes. The LONN6004 is CIP-compatible and rated for clean-in-place cycles at temperatures up to 85°C with caustic solution (NaOH, 1-2%) and acid rinse (HNO₃, 0.5-1%). The standard EPDM seals are rated for CIP temperatures up to 130°C. The plant’s standard CIP cycle (45 minutes, caustic followed by acid rinse) is applied after each production batch.
Q: How is the Brix-to-density correlation maintained over time? A: The plant’s QA department performs a monthly correlation validation by comparing the inline density reading against a laboratory refractometer measurement from a production sample. If the correlation drifts beyond ±0.1 Brix, the conversion table is updated. In 12 months of operation, the correlation required adjustment only once — after a change in concentrate supplier that altered the refractive index characteristics of the base material.
Q: What about seasonal variation in raw material Brix? A: The PID controller adapts automatically to incoming raw material Brix within the first 5 minutes of each batch, as the density sensor provides continuous feedback. The setpoint (target Brix for the finished product) remains constant — the controller adjusts the sugar syrup injection rate to achieve that setpoint regardless of the incoming juice Brix. This is a significant advantage over manual batching, where operators had to manually estimate the sugar correction required.
Q: Can the system handle product changeovers between different SKUs? A: Yes. Each product SKU has its own Brix-to-density conversion table stored in the DCS. When the batch recipe is selected at the start of production, the DCS automatically loads the corresponding setpoint and conversion table. The operator confirms the inline density reading matches the expected value before starting the batch — providing a check against incorrect recipe selection.
8. Conclusion
The deployment of LONNMETER food grade density measurement at this Shandong beverage plant demonstrates that sugar management — one of the highest-cost variables in beverage manufacturing — can be brought under continuous automatic control with the right instrumentation.
The results are compelling: a 41% reduction in sugar waste, a 67% reduction in batch rejection rate, and a payback period of just over 4 months. The most valuable capability, however, was not captured in the financial figures: the elimination of the seasonal transition waste period, which had been a chronic problem for NFC juice production, was entirely resolved by the continuous adaptive control of the PID system.
For any beverage, food processing, or dairy manufacturer currently relying on laboratory refractometer or density measurements for Brix or concentration control, the case for inline food grade density measurement is clear — both in terms of direct financial return and in improved process capability and documentation.
Request a Quote
To discuss food grade density measurement for your beverage, food processing, or dairy application, LONNMETER offers process-specific consultation and on-site trials.
Contact: anna@xalonn.com
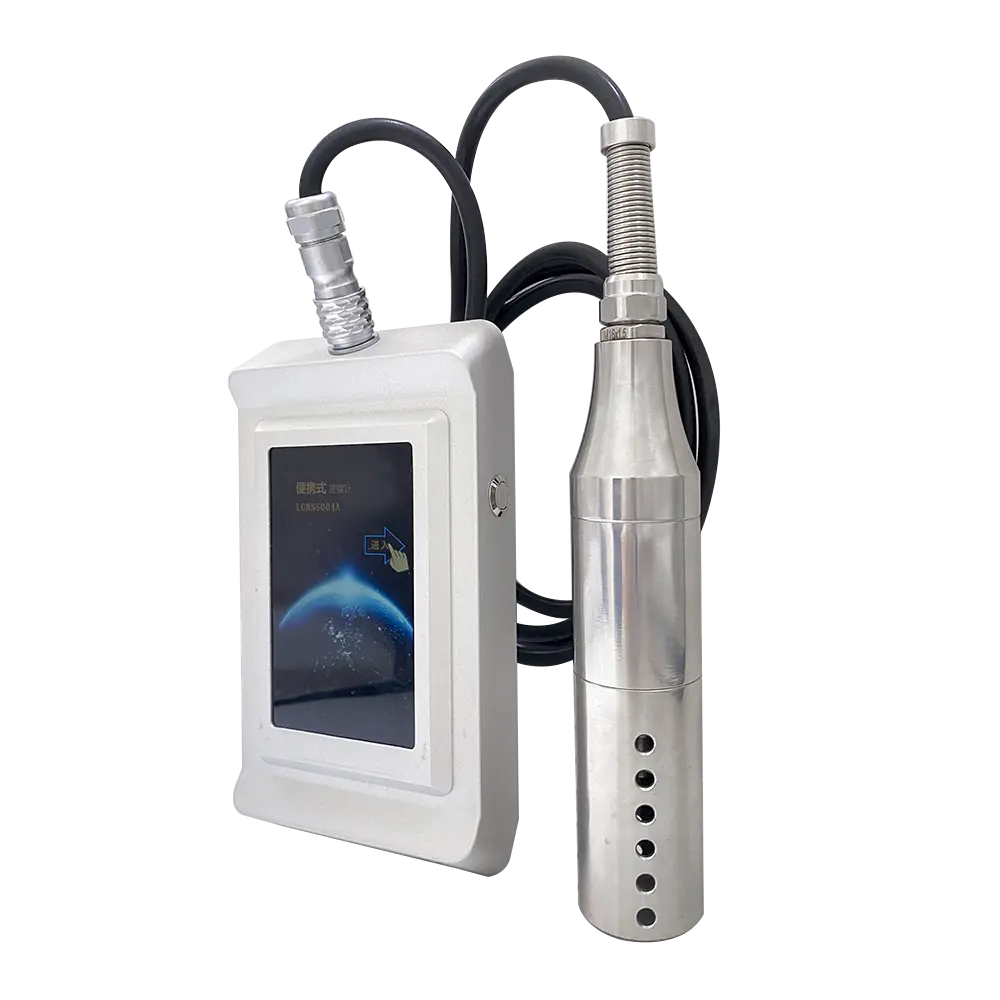
Products referenced: LONN6004 Food Grade Density Meter | LONN-800T Portable Density Meter
Related Case Study: Paint Viscosity Control — Coatings Plant