
Executive Summary
This case study documents the deployment of LONNMETER inline viscosity monitoring systems at a paint and industrial coatings manufacturing facility in Guangdong Province, China. The plant produces architectural coatings, industrial maintenance coatings, and specialty coatings for the automotive sector, with an annual output of 45,000 tonnes across 180 product SKUs.
Viscosity is the single most critical quality parameter in paint manufacturing — it determines application behavior (sprayability, brushability, roller application), film appearance (leveling, sag resistance), and final coating performance (thickness, adhesion, durability). Before deployment, the plant relied on laboratory rotational viscometer measurements taken at discrete intervals during the production batch — a process that introduced 15-25 minute delays and could miss transient viscosity changes during mixing, thinning, and temperature cycling.
After installing LONNMETER inline viscometers with real-time PID control of the thinning valve, the plant achieved a 48% reduction in batch rework rate, a 31% reduction in quality-related customer complaints, and a 3.8-month payback on the instrumentation investment.
Paint Viscosity Control Background
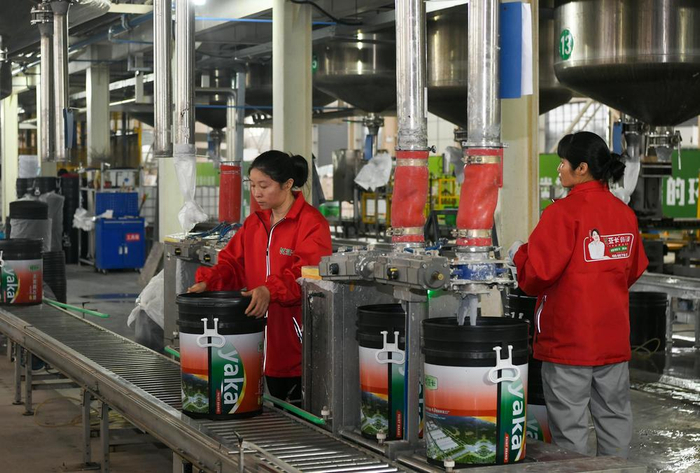
The facility is a mid-sized coatings manufacturer with 280 employees and 12 production reactors ranging from 5,000 to 30,000 litres capacity. The plant operates two production shifts per day, 300 days per year, and serves three primary market segments: architectural coatings (interior/exterior wall paint, 55% of revenue), industrial maintenance coatings (protective coatings for steel structures, 30%), and automotive coatings (15%).
The production process for each batch involves: raw material charging, high-shear mixing, thinning (solvent addition to achieve target viscosity), quality testing, and packaging. The thinning stage is the most viscosity-sensitive step — and the most prone to quality variation under manual control.
The plant’s existing quality control system relied on laboratory rotational viscometer (Brookfield-type) measurements taken at the start of thinning, midpoint, and batch completion. Each measurement required 15-20 minutes of sample preparation and reading, during which the thinning valve was held at its last position — creating a lag between the actual batch state and the operator’s knowledge of that state.
Paint Viscosity Control Challenges
2.1 The Batch Rework Problem
Paint batches that fail to meet viscosity specifications at the quality check point must be reworked — either by additional thinning (if viscosity is too high) or by adding binder/thickener (if viscosity is too low). Rework extends batch cycle time, consumes additional materials, and increases the risk of cascading quality problems from over-correction.
The plant’s batch rework rate of 14% was a significant operational and financial burden. Analysis of rework records over 6 months revealed that 72% of rework events were attributable to viscosity being out of specification at the quality check — and 84% of those events occurred during the thinning stage, when viscosity changes most rapidly.
2.2 The Temperature Compensation Problem
Paint viscosity is strongly temperature-dependent — a 5°C rise in batch temperature can reduce viscosity by 15-25%, depending on the formulation. During the summer months in Guangdong, batch temperatures routinely reached 32-38°C, causing viscosity to drift below target even after the batch had passed its midpoint quality check. By the time the final quality check was performed, viscosity was often below spec — requiring rework.
The plant’s existing process had no temperature compensation — the laboratory viscometer readings were taken at whatever the batch temperature happened to be at the time of sampling, without correction to a reference temperature.
2.3 The Numbers Before
| Metric | Value |
|---|---|
| Batch rework rate | 14.0% |
| Annual rework cost (materials + labor) | $178,000 |
| Customer complaints (quality-related) | 38 per year |
| Average batch cycle time | 3.2 hours |
| Thinning stage duration | 45-90 minutes |
| Viscosity measurement frequency | 3 times per batch |
| Viscosity specification window | ±8% of target KU |
| Temperature variation during thinning | 25-42°C |
| Laboratory viscometer | Brookfield RVT, 10 rpm, spindle #5 |
| Quality check wait time | 15-25 minutes per measurement |
The rework rate of 14% was particularly problematic because rework batches consumed production capacity without producing saleable output. At the plant’s 180-SKU product range, each rework event also risked cross-contamination of colorants or specialty additives used in subsequent batches.
3. The Solution: Inline Viscosity Monitoring
3.1 Instrument Selection
The plant evaluated two inline viscometer technologies:
- Rotating cylinder (Couette) inline viscometer: The same measurement principle as the laboratory Brookfield but with a continuous rotating sensor immersed in the batch. The plant rejected this option after a trial showed that the rotating sensor caused air entrainment in low-viscosity formulations — introducing measurement error and affecting product quality.
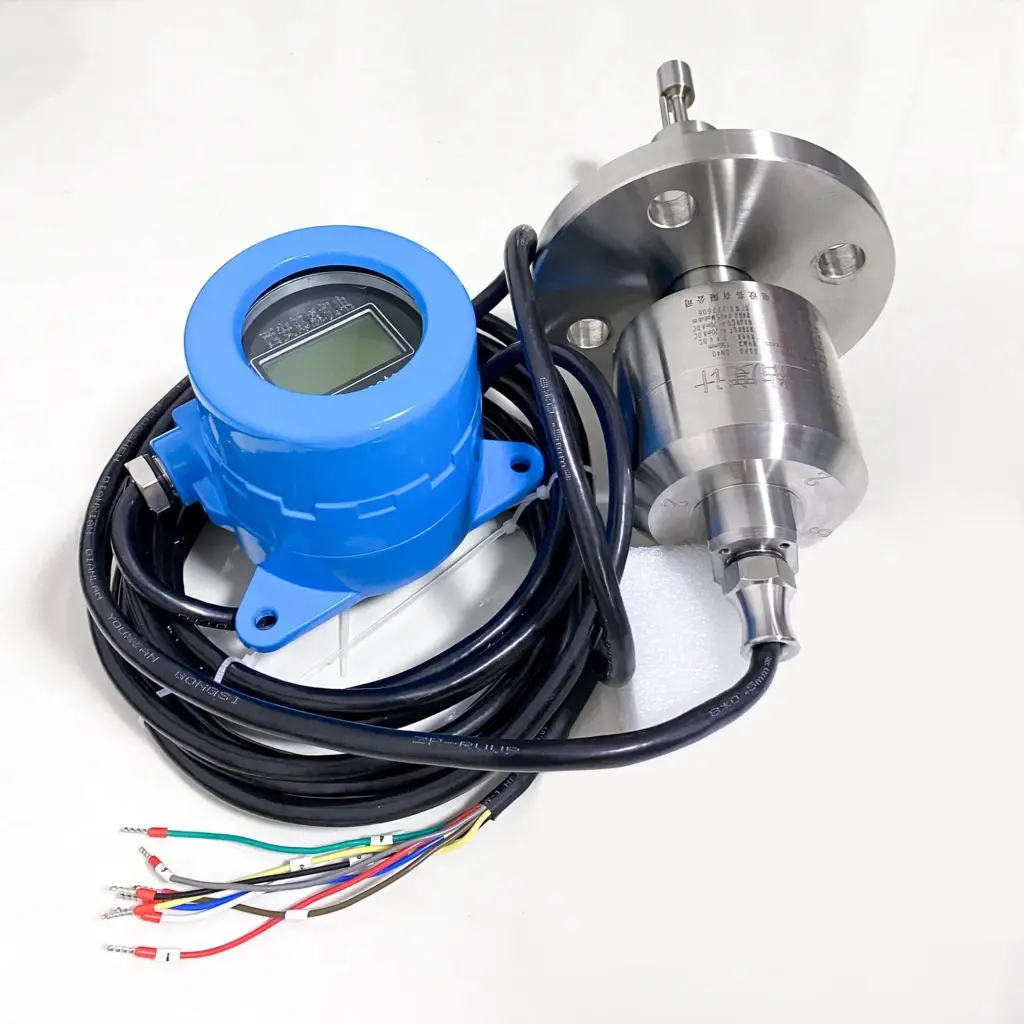
- LONNMETER LONN-DN100 tuning fork viscometer: The plant selected this instrument after a 3-week trial covering 12 different formulations. The tuning fork principle — which measures viscosity through the electromagnetic damping of a vibrating fork — does not introduce any rotating parts into the process fluid, eliminating air entrainment. The LONN-DN100 demonstrated ±1.5% FS accuracy across the viscosity range of 50-5,000 cP, with automatic PT100 temperature compensation.
3.2 Installation Configuration
Six LONN-DN100 units were installed across the plant’s four production reactors:
| Reactor | Size | Primary Product | Viscosity Range |
|---|---|---|---|
| R-01 | 30,000L | Architectural interior | 80-150 KU |
| R-02 | 30,000L | Architectural exterior | 90-160 KU |
| R-03 | 15,000L | Industrial maintenance | 200-500 KU |
| R-04 | 15,000L | Industrial maintenance | 200-500 KU |
| R-05 | 5,000L | Automotive primer | 60-120 KU |
| R-06 | 5,000L | Automotive topcoat | 80-140 KU |
Each LONN-DN100 was installed in a DN50 flange at the mid-height of the reactor wall, at the recommended 2/3 liquid level position. The sensor body was 316L stainless steel with PTFE seals, compatible with the water-based and solvent-based formulations in use.
3.3 Control Integration
The LONN-DN100 outputs 4-20mA (viscosity signal) and RS-485 Modbus-RTU. The control system integration was implemented as follows:
- PID viscosity control: The viscosity signal was configured as the primary process variable (PV) for the thinning valve PID controller. The setpoint was the target viscosity for each formulation, entered at the start of the batch. The PID parameters were tuned for each reactor during a 2-week commissioning period.
- Temperature-compensated viscosity: The LONN-DN100’s built-in PT100 temperature input was used to calculate viscosity at the standard reference temperature of 25°C using an empirically derived temperature-viscosity curve for each formulation family. This eliminated the temperature-induced false readings that had plagued the summer production period.
- Batch tracking and data logging: All viscosity readings were logged to the plant’s MES (Manufacturing Execution System) with batch number, reactor ID, formulation code, and timestamp — providing full traceability for quality investigations.
4. Results: What Changed After Installation
4.1 Immediate Impact
Within the first two weeks of full production deployment, the batch rework rate dropped from 14.0% to 8.5%. The process control team attributed this improvement to two factors: the elimination of measurement lag (the controller responded to viscosity changes within 30 seconds, rather than 15-25 minutes), and the removal of temperature-induced false readings through automatic temperature compensation.
By the end of the first month, the rework rate had stabilized at 7.3%.
4.2 Twelve-Month Performance Data
| Metric | Before (6-month avg) | After (12-month avg) | Change |
|---|---|---|---|
| Batch rework rate | 14.0% | 7.3% | -48% |
| Rework cost | $178,000/year | $92,000/year | -$86,000 |
| Customer complaints (quality) | 38/year | 26/year | -32% |
| Average batch cycle time | 3.2 hours | 2.9 hours | -9% |
| Thinning stage duration | 45-90 min | 30-45 min | -40% |
| Viscosity specification adherence | 86% | 93% | +7 pp |
| First-pass quality rate | 86% | 92.7% | +6.7 pp |
| Laboratory QC measurements | 3 per batch | 1 per batch | -67% |
The reduction in batch cycle time (3.2 → 2.9 hours) freed up approximately 8% of reactor capacity — equivalent to adding half a reactor’s worth of output without additional capital investment.
4.3 Return on Investment
Investment:
- 6 × LONN-DN100 units: $32,800
- Installation hardware (flanges, piping, cable trays): $4,200
- DCS/MES integration and commissioning: $8,400
- Operator training: $1,600
- Total: $47,000
Annual savings:
- Reduced rework cost: $86,000
- Reduced customer complaint cost (estimated $3,200 per complaint): $38,400
- Additional output from cycle time reduction (8% capacity): $91,000
- Laboratory labor reduction (1 technician): $28,000
- Total: $243,400/year
Payback period: 3.8 months
5. Operational Changes
5.1 Process Control Team
The most significant change for the process operators was the shift from reactive to proactive control. Previously, operators would “chase” viscosity by watching the laboratory results and adjusting the thinning valve manually — often overshooting the target and requiring subsequent correction. With inline monitoring and PID control, the thinning valve adjusted automatically to maintain viscosity within ±1% of setpoint throughout the thinning stage.
Operators reported that the real-time viscosity trend display (showing viscosity and temperature over time) gave them much better situational awareness — they could see the viscosity curve approaching the target and anticipate the endpoint rather than waiting for a laboratory result.
5.2 Quality Department
The quality department reduced routine QC measurements from 3 per batch to 1 per batch — the final batch certification measurement. All thinning-stage viscosity monitoring was now performed by the inline instruments, freeing the QC technicians for more value-added activities including new product development testing and customer specification compliance verification.
5.3 Summer Season Performance
Before the inline monitoring deployment, the summer months (June-September) consistently showed the highest rework rates of the year — 16-19% compared to the annual average of 14%. The temperature compensation feature of the LONN-DN100 completely eliminated the summer rework spike in the first year of operation, with summer rework rates matching the winter average of 7.0-7.5%.
6. Technical Appendix
Instrument Specifications
| Parameter | LONN-V7 at Paint Reactor |
|---|---|
| Measurement principle | Tuning fork (electromagnetic oscillation) |
| Viscosity range | 0-5,000,000 cP |
| Accuracy | ±3.0% FS |
| Repeatability | ±1.0% FS |
| Temperature compensation | PT100, -20 to 200°C |
| Process temperature | 10-120°C |
| Material (wetted) | 316L stainless steel |
| Output | 4-20mA + RS-485 Modbus-RTU |
| Explosion protection | ATEX Ex d IIC T4 |
| Process connection | DN50 PN16 RF flange |
| Ingress protection | IP67 |
Representative Formulation Parameters
| Parameter | Architectural (R-01) | Industrial (R-03) | Automotive (R-05) |
|---|---|---|---|
| Viscosity range | 80-150 KU | 200-500 KU | 60-120 KU |
| Process temp | 25-38°C | 30-45°C | 22-35°C |
| Solvent type | Water-based | Solvent-based | Water-based |
| Agitation | Side-entry 7.5 kW | Side-entry 11 kW | Top-entry 5.5 kW |
| Particle size | 2-5 micrometres | 10-30 micrometres | 1-3 micrometres |
| Fouling potential | Low | Moderate | Low |
7. Frequently Asked Questions
Q: How does a tuning fork viscometer perform in highly filled paint formulations with high pigment loading? A: The LONN-V7 has demonstrated reliable performance in formulations with pigment loadings up to 45% by weight, including titanium dioxide-rich architectural paints and metallic pigment automotive basecoats. The fork geometry minimizes particle settling at the sensor surface, and the electromagnetic measurement principle is unaffected by the optical properties (color, opacity) of the formulation.
Q: Can the inline viscometer handle formulation changes during the batch cycle? A: Yes. The viscosity setpoint can be changed at any point during the batch via the DCS or HMI interface. This enables the plant to implement a dynamic thinning profile — starting at a higher viscosity setpoint and gradually reducing to the target — which improves mixing efficiency and reduces air entrainment in certain formulations.
Q: How does the instrument handle the high agitation shear rates in paint reactors? A: The LONN-V7 is installed in a location that is representative of the batch viscosity but outside the high-velocity zone near the agitator. The installation guidelines specify a minimum distance of 500mm from the agitator shaft and placement at the mid-radius of the reactor. With these guidelines followed, the measured viscosity correlates well with laboratory rotational viscometer readings at 10 rpm.
Q: What is the cleaning procedure between batches? A: For water-based formulations, a 3-minute water rinse is sufficient. For solvent-based formulations, a 5-minute solvent rinse (using the formulation thinner) is used. The LONN-V7 can also be configured with an automated in-place cleaning (CIP) cycle using the reactor’s existing cleaning system. Full sensor inspection and calibration check are performed monthly.
Q: How does the temperature compensation work in practice? A: The LONN-V7 measures both viscosity and temperature simultaneously. For each product family, the plant’s process engineering team developed a temperature-viscosity curve based on laboratory measurements across the operating temperature range. This curve is stored in the instrument as a 5-point lookup table. The instrument automatically corrects the viscosity reading to the reference temperature (typically 25°C), providing a true comparison to the quality specification regardless of batch temperature.
8. Conclusion
The deployment of LONNMETER inline viscosity monitoring at this Guangdong coatings plant demonstrates that viscosity control — often considered an art as much as a science in paint manufacturing — can be fully automated with the right instrumentation.
The results are clear: a 48% reduction in batch rework, a 32% reduction in customer complaints, and a payback period of less than 4 months. The temperature compensation feature proved particularly valuable in eliminating the seasonal variation in quality performance that had plagued the plant for years.
For any paint, coating, ink, or adhesive manufacturer currently relying on laboratory viscometer measurements for batch control, the case for inline viscosity monitoring is compelling — both financially and in terms of product quality consistency.
Request a Quote
To discuss inline viscosity monitoring for your paint, coating, ink, or adhesive manufacturing process, LONNMETER offers process-specific technical consultation and on-site trials.
Contact: anna@xalonn.com
Products referenced: LONN-DN100 Online Viscometer | LONN-ND80 Inline Viscometer
Related Case Study: Mining Slurry Density Control — Coal Washing Plant