
Introduction
Every process plant faces the same fundamental question: How do we know the density of our product right now?
For decades, the answer was simple — send a sample to the lab. An operator pulls a grab sample from the pipeline, walks it to the quality control laboratory, and waits for a technician to run it through a digital density meter. Fifteen to thirty minutes later, you have a number. Accurate, traceable, defensible.
But that number describes the process fifteen minutes ago. In a continuous chemical reactor, a batch polymerization vessel, or a pipeline blending operation, fifteen minutes is an eternity. A batch can go off-specification, a reactor can overshoot conversion, or a blender can deliver off-grade product — all while you’re waiting for the lab result.
Inline density measurement changes the equation entirely. A sensor installed directly in the process pipeline delivers continuous, real-time density data every second. No sampling. No delay. No laboratory queue.
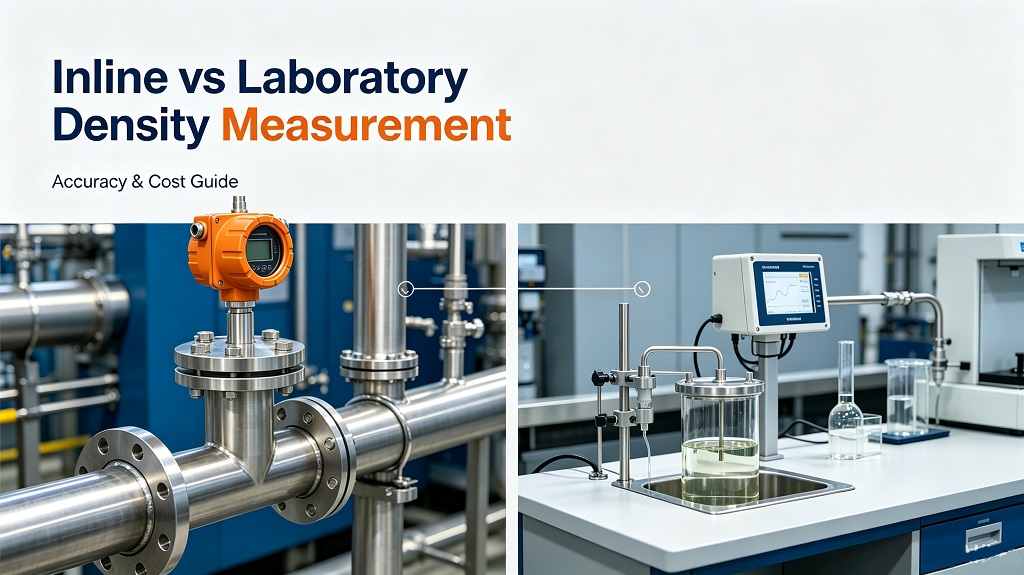
This guide delivers a complete, engineer-to-engineer inline vs laboratory density measurement comparison. Understanding the inline vs laboratory density measurement trade-offs is essential for process engineers optimizing quality control systems. You’ll get the accuracy data, the cost analysis, the operational trade-offs, and a decision framework used by LONNMETER field engineers to match the right measurement approach to each application.
How Each Method Works
Laboratory Density Measurement
Laboratory density measurement relies on grab sampling — physically removing a representative sample from the process and transporting it to a controlled environment for analysis. The measurement itself is performed by one of three technologies:
Oscillating U-Tube (Digital Density Meter) The gold standard for laboratory density measurement. A precision U-shaped glass or metal tube is filled with sample and vibrated at its resonant frequency. The mass of the sample determines the oscillation frequency; denser samples produce lower frequencies. Modern instruments like the Anton Paar DMA series achieve ±0.0001 g/cm³ accuracy with 0.001°C temperature control.
Hydrometer (ASTM D1298) The traditional method: a weighted glass float sinks to a depth proportional to liquid density. Simple, inexpensive, and universally understood — but limited to ±0.001 g/cm³ accuracy and requiring visual reading. Still common in petroleum and fuel testing.
Pycnometer (ASTM D4052) A glass vessel of precisely known volume is filled with sample and weighed. Density equals mass divided by volume. Highly accurate for reference work but slow and labor-intensive.
The laboratory workflow:
- Operator extracts grab sample from process point
- Sample transported to laboratory (1–30 minutes depending on distance)
- Sample conditioned to reference temperature (if required)
- Instrument calibrated with reference fluids
- Sample analyzed (30 seconds to 5 minutes)
- Result recorded and reported
Total elapsed time: 15–60 minutes from sample extraction to reported result.
Inline Density Measurement
Inline density measurement uses a continuous sensor installed directly in the process pipeline or a by-pass loop. The sensor remains in contact with the process fluid and generates a density signal at intervals of one second or faster.
Tuning Fork (Vibrational) Density Meter A pair of metal tines is immersed in the process fluid and excited at its natural resonant frequency. The resonant frequency decreases as fluid density increases. The frequency shift is measured with sub-Hertz resolution and converted to density via a calibration curve. The LONN-700CM delivers ±0.002 g/cm³ accuracy with 4-20mA and Modbus outputs.
Ultrasonic (Acoustic Impedance) Density Meter An ultrasonic pulse is transmitted through the fluid; the acoustic impedance (Z = ρ × c) correlates with density. The LONN7000 handles slurries up to 40% suspended solids with ±1% accuracy.
Coriolis Mass Flow Meter A vibrating tube through which process fluid flows; the Coriolis force causes a phase shift proportional to mass flow rate, and the resonant frequency provides density. Highly accurate (±0.001 g/cm³) but expensive and limited to smaller pipe sizes.
The inline workflow:
- Sensor installed in process pipeline or by-pass loop
- Continuous measurement at process conditions
- Real-time signal transmitted to DCS/PLC (4-20mA, Modbus, HART)
- Data available immediately for control and monitoring
Total elapsed time: 1 second from process condition to reported result.
Head-to-Head Comparison
| Parameter | Laboratory (Grab Sample) | Inline (Continuous) |
|---|---|---|
| Measurement frequency | Every 15–60 minutes (batch) | Continuous, 1-second updates |
| Time to result | 15–60 minutes | 1 second |
| Typical accuracy | ±0.0001 to ±0.001 g/cm³ | ±0.001 to ±0.002 g/cm³ |
| Repeatability | ±0.00005 g/cm³ | ±0.0005 g/cm³ |
| Temperature control | Precise (±0.001°C) | Process temperature (compensated) |
| Sample representativeness | Risk of stratification, contamination, time lag | Measures actual process conditions |
| Labor cost | High (operator + technician time) | Low (automated, no sampling) |
| Capital cost | $5,000–$30,000 (instrument only) | $4,500–$15,000 (instrument + installation) |
| Operating cost | $15,000–$50,000/year (labor, consumables) | $500–$2,000/year (calibration, maintenance) |
| Process control capability | Manual adjustment based on historical data | Closed-loop automatic control |
| Detection of rapid changes | Impossible | Immediate |
| Hazardous sample handling | Operator exposure risk | No exposure (sensor in sealed line) |
| Environmental impact | Waste sample disposal | Zero waste (no sample withdrawal) |
| Traceability/certification | Excellent (NIST-traceable standards) | Good (periodic verification against lab) |
| Suitability for custody transfer | Preferred (defensible, standard methods) | Acceptable with proper calibration protocol |
| Slurry/abrasive fluids | Difficult (sample preparation required) | Straightforward (proper sensor selection) |
| Installation complexity | Laboratory infrastructure required | Process shutdown for installation |
| Maintenance burden | Instrument calibration, consumables | Sensor cleaning (fouling service), calibration verification |
Accuracy Comparison: The Real Numbers
Laboratory Accuracy
A properly maintained digital density meter (oscillating U-tube) achieves:
- Accuracy: ±0.0001 g/cm³ (Anton Paar DMA 5000) to ±0.001 g/cm³ (industrial lab meters)
- Repeatability: ±0.00005 g/cm³
- Temperature control: ±0.001°C
This is the absolute accuracy benchmark against which all other methods are judged.
Inline Accuracy
Modern inline density meters achieve:
- Tuning fork: ±0.001 to ±0.002 g/cm³ (LONN-700CM: ±0.002 g/cm³)
- Coriolis: ±0.001 g/cm³ (high-end models)
- Ultrasonic: ±1% of reading (±0.005 to ±0.02 g/cm³ depending on range)
The inline measurement is performed at process conditions — the actual temperature and pressure of the fluid in the pipeline. Laboratory measurements are performed at reference conditions (typically 20°C or 15°C). Converting between process and reference conditions introduces additional uncertainty from thermal expansion coefficients and compressibility data.
The Accuracy Paradox
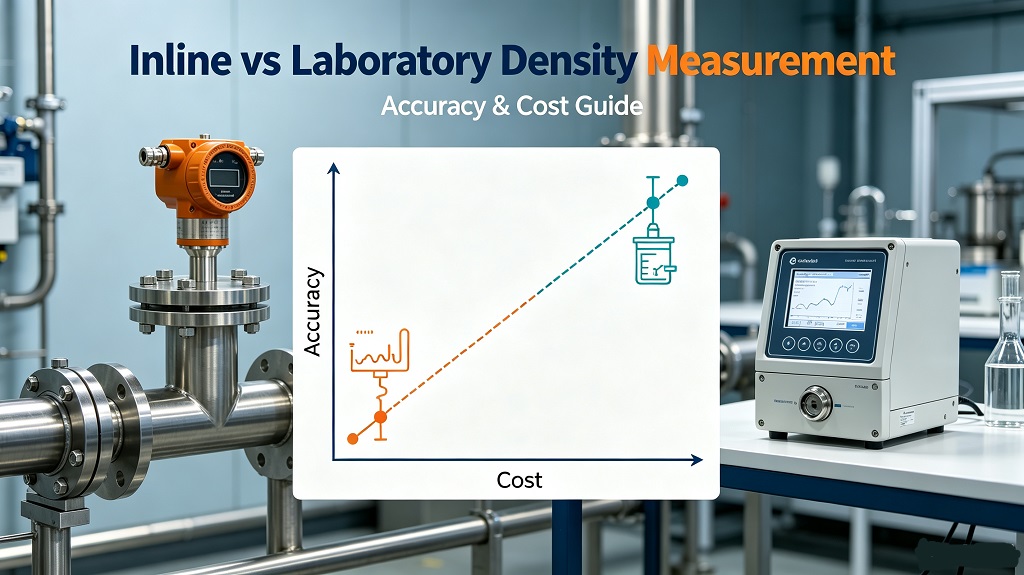
Here’s the counterintuitive reality: inline density measurement often delivers better process control than laboratory measurement, even with lower absolute accuracy.
Consider a chemical reactor where product density indicates reaction completion:
- Laboratory: ±0.0005 g/cm³ accuracy, 30-minute delay
- Inline: ±0.002 g/cm³ accuracy, 1-second delay
If the reaction goes off-specification, the laboratory method detects it 30 minutes after it occurs — potentially an entire batch. The inline method detects it immediately, enabling correction before significant off-spec product is produced.
For process control, timeliness beats absolute accuracy.
Cost Analysis: Total Cost of Ownership
Laboratory Measurement Costs (Annual, Single Point)
| Cost Category | Amount | Notes |
|---|---|---|
| Capital | $5,000–$30,000 | Digital density meter, one-time |
| Labor (sampling) | $8,000–$25,000 | 1–2 hours/day @ $40/hour |
| Labor (analysis) | $5,000–$15,000 | Technician time, 0.5–1.5 hours/day |
| Consumables | $1,000–$3,000 | Reference fluids, solvents, vials |
| Maintenance | $1,000–$2,000 | Calibration, repairs |
| Waste disposal | $500–$1,500 | Hazardous sample disposal |
| Annual Total | $15,500–$46,500 | Year 1: $20,500–$76,500 with capital |
Inline Measurement Costs (Annual, Single Point)
| Cost Category | Amount | Notes |
|---|---|---|
| Capital | $4,500–$15,000 | Instrument + installation, one-time |
| Labor | $500–$1,500 | Periodic verification, calibration |
| Consumables | $0–$200 | Reference fluids for verification |
| Maintenance | $500–$2,000 | Cleaning, calibration, parts |
| Annual Total | $1,000–$3,700 | Year 1: $5,500–$18,700 with capital |
Payback Calculation
For a typical chemical process with one density measurement point:
- Laboratory annual cost: $25,000
- Inline annual cost: $2,500
- Annual savings: $22,500
- Capital investment: $8,000
- Simple payback: 4.3 months
With 5 measurement points (common in a process plant):
- Annual savings: $112,500
- Capital investment: $40,000
- Simple payback: 4.3 months
The economics strongly favor inline measurement for any process with more than one or two density monitoring points.
Where Laboratory Measurement Wins in Inline vs Laboratory Density Measurement
1. Custody Transfer and Legal Defensibility
For custody transfer of high-value products (petroleum, chemicals, pharmaceuticals), laboratory measurement using ASTM or ISO standard methods provides legal defensibility. The measurement is performed by a trained technician using calibrated equipment with NIST-traceable standards — a chain of custody that holds up in commercial disputes.
Inline measurement can support custody transfer, but requires:
- A documented calibration protocol
- Periodic verification against laboratory standards
- Agreement between buyer and seller on measurement uncertainty
For multi-million dollar product transfers, the legal risk of inline measurement often outweighs the operational benefit.
2. Reference and Dispute Resolution
When two parties disagree on product density — a supplier and customer, or two laboratories — the ultimate arbiter is a third-party laboratory measurement using standardized methods. Inline sensors are verified against laboratory standards; they do not replace them.
Every inline installation should include a provision for periodic laboratory verification — typically monthly or quarterly — to confirm calibration drift has not occurred.
3. Complex or Unusual Fluids
For fluids with unusual properties — high viscosity, high vapor pressure, reactive components, or extreme temperatures — laboratory measurement allows controlled conditions and careful observation of sample behavior. Inline sensors may struggle with:
- Fluids that solidify at ambient temperature
- Highly reactive fluids that degrade in sampling containers
- Fluids requiring extreme temperature or pressure for stable measurement
4. Regulatory Compliance
Some regulatory frameworks specify laboratory measurement for compliance reporting. Environmental discharge monitoring, pharmaceutical batch release, and food safety testing often require documented laboratory analysis by certified personnel.
Where Inline Measurement Wins in Inline vs Laboratory Density Measurement
1. Real-Time Process Control
This is the overwhelming advantage of inline measurement. In any process where density changes rapidly — chemical reactions, blending operations, crystallization, polymerization — laboratory measurement is simply too slow for effective control.
Example: Batch Chemical Reactor
- Reaction completion indicated by density reaching target
- Laboratory measurement: 30-minute delay
- Inline measurement: 1-second update
- With inline: Reactor discharged at exact completion, maximizing yield
- With laboratory: Reactor held 30 minutes past completion, or discharged early with incomplete conversion
Example: Pipeline Blender
- Gasoline blending controlled by inline density (correlates to octane)
- Laboratory measurement: Blend completed, sample sent to lab, result returned 45 minutes later
- Inline measurement: Blend adjusted in real-time to hit target density
- With inline: Zero off-spec blends; with laboratory: 2–5% off-spec product requiring reprocessing
2. Closed-Loop Automatic Control
Inline density signals integrate directly into distributed control systems (DCS) and programmable logic controllers (PLC) for automatic control:
- Density-controlled reactant addition
- Density-controlled cooling or heating
- Density-triggered batch discharge
- Density-based quality diversion (off-spec to holding tank)
Laboratory measurements require manual intervention — an operator receives the result and adjusts the process. This introduces human delay, inconsistency, and error.
3. Hazardous or Toxic Fluids
Sampling hazardous fluids — concentrated acids, toxic chemicals, radioactive materials — exposes operators to risk. Inline measurement eliminates sampling entirely, with the sensor sealed in the process line and the electronics in a safe area or explosion-proof enclosure.
For fluids with exposure limits measured in parts per million, inline measurement is often the only practical approach.
4. Environmental and Waste Reduction
Every grab sample is waste — fluid removed from the process and sent to disposal. For a plant with 50 sampling points and 4 samples per day per point:
- 200 samples/day
- 50 mL per sample = 10 liters/day
- 3,650 liters/year of waste
At $2/liter disposal cost for hazardous waste: $7,300/year in disposal costs alone, plus environmental impact.
Inline measurement generates zero waste.
5. Slurry and Abrasive Fluids
Sampling slurries is problematic:
- Particles settle in sample containers before analysis
- Abrasive particles damage laboratory instruments
- Representative sampling requires specialized techniques
Inline sensors designed for slurry service (ultrasonic, ceramic tuning fork) handle abrasive fluids without degradation. The LONN7000 ultrasonic density meter operates for years in 40% solids copper flotation slurry with zero maintenance.
Hybrid Approach: The Best of Both Worlds
Most process plants use a hybrid approach:
- Inline sensors for real-time process control and monitoring
- Laboratory analysis for calibration verification, custody transfer, and regulatory compliance
Typical implementation:
- Install inline density meter for continuous monitoring and control
- Configure automatic alarms for out-of-specification conditions
- Perform periodic laboratory verification (weekly, monthly, or quarterly)
- Use laboratory results to adjust inline calibration if drift detected
- Retain laboratory measurement for custody transfer and regulatory reporting
This delivers the operational benefits of inline measurement (speed, automation, safety) while maintaining the legal and reference benefits of laboratory measurement (accuracy, traceability, defensibility).
Decision Framework
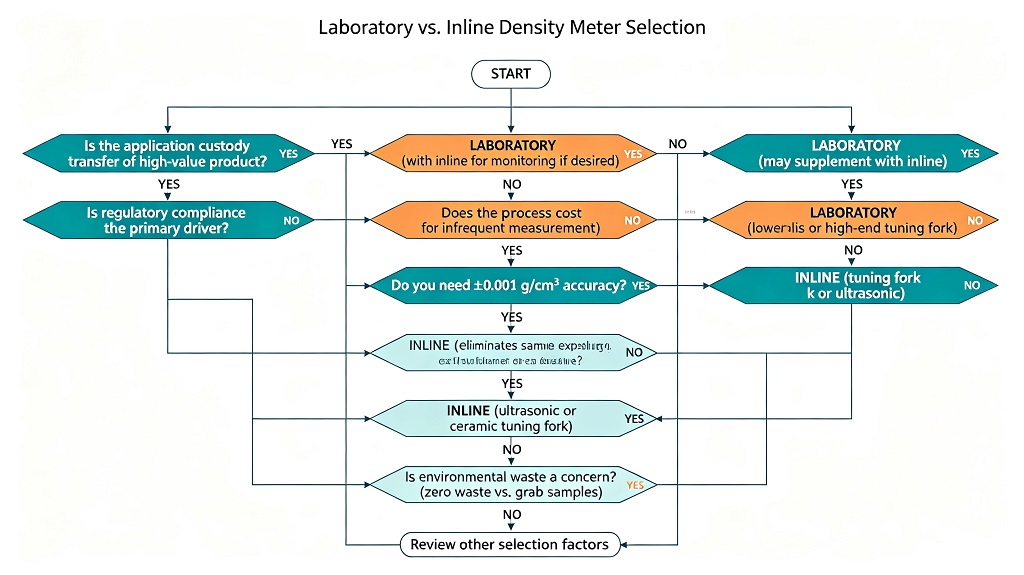
Use this decision tree to select the right measurement approach:
LONNMETER Product Recommendations
| Application | Recommended Method | Recommended Model | Key Feature |
|---|---|---|---|
| Real-time process control, clean liquids | Inline | LONN-700CM | ±0.002 g/cm³, 4-20mA + Modbus |
| Slurry service, mining, abrasive | Inline | LONN7000 | Up to 40% solids, non-intrusive |
| Custody transfer verification | Laboratory reference | N/A | Verify inline against lab standard |
| High-accuracy blending | Inline | LONN-700CM + lab verification | ±0.002 g/cm³ with monthly lab check |
| Hazardous/toxic fluids | Inline | LONN-700CM (ATEX/IECEx) | No sampling, explosion-proof |
| Sanitary food/dairy | Inline | LONN7000 (sanitary) | 3-A compliant, CIP compatible |
All LONNMETER inline instruments use non-radioactive measurement principles and are certified to ATEX, IECEx, and ISO 9001 standards.
Frequently Asked Questions
Q1: In an inline vs laboratory density measurement comparison, which is more accurate?
Inline density measurement achieves ±0.001 to ±0.002 g/cm³ accuracy with modern tuning fork or Coriolis sensors — approximately 2–10× less accurate than a high-end laboratory digital density meter (±0.0001 g/cm³). However, for process control, timeliness often matters more than absolute accuracy.
Consider: a ±0.002 g/cm³ measurement available immediately enables corrective action before significant off-spec product is produced. A ±0.0001 g/cm³ measurement available 30 minutes later only tells you that the problem already occurred. For real-time control, inline is superior; for reference and custody transfer, laboratory remains the standard.
Q2: How often should inline density meters be verified against laboratory standards?
Best practice is monthly verification for critical applications (custody transfer, high-value product) and quarterly verification for general process control. The verification procedure:
- Extract a grab sample from the process at the inline sensor location
- Analyze immediately in the laboratory
- Compare inline reading (at process conditions) to laboratory reading (at reference conditions)
- Adjust for temperature difference using thermal expansion coefficient
- If difference exceeds ±0.003 g/cm³, recalibrate inline sensor
Some plants implement automatic validation systems where a sample is automatically extracted and routed to a laboratory analyzer on a programmed schedule.
Q3: Can inline sensors replace laboratory analysis entirely?
For process control and monitoring: yes. Inline sensors provide continuous data superior to periodic laboratory analysis for real-time decision-making.
For custody transfer, regulatory compliance, and reference measurement: no. Laboratory analysis using standardized methods remains required for legal defensibility and regulatory reporting. The hybrid approach — inline for control, laboratory for verification — is the industry standard.
Q4: What is the payback period for inline vs laboratory density measurement conversion?
Typical payback is 4–6 months for a single measurement point, based on:
- Labor savings: $15,000–$30,000/year (eliminating sampling and analysis)
- Waste disposal savings: $500–$2,000/year
- Quality improvement: 2–5% reduction in off-spec product (value depends on product)
- Capital investment: $5,000–$15,000 per point
For plants with multiple measurement points, the economics are compelling — a 10-point installation saves $150,000–$300,000 annually with a capital investment of $50,000–$150,000.
Q5: Do inline density meters work with slurries and abrasive fluids?
Yes, with proper sensor selection. Standard tuning fork sensors handle clean liquids and light slurries (up to 5–10% solids). For abrasive slurries:
- Ultrasonic sensors (LONN7000): Non-intrusive, handles up to 40% solids and particles to 5 mm
- Ceramic tuning fork sensors (LONN-700C): Ceramic tines (1200+ HV hardness) withstand abrasive particles
Laboratory analysis of slurries is problematic due to particle settling and instrument damage. Inline measurement is often the only practical approach for slurry density monitoring.
Q6: How do temperature differences between process and laboratory affect measurement?
Laboratory density meters control sample temperature precisely (typically 20°C or 15°C). Inline sensors measure at process temperature (which may vary from -40°C to +200°C). Density changes with temperature according to the fluid’s thermal expansion coefficient.
Example: A hydrocarbon with thermal expansion coefficient 0.001/°C:
- Process temperature: 80°C
- Laboratory temperature: 20°C
- Temperature difference: 60°C
- Density difference: 0.06 g/cm³
Inline sensors include temperature compensation algorithms that calculate density at a reference temperature. The compensation accuracy depends on the accuracy of the thermal expansion coefficient — for pure fluids, excellent; for mixtures, approximate. For highest accuracy, inline and laboratory measurements should be compared at the same temperature.
Q7: Can one inline sensor measure both density and viscosity?
Tuning fork density meters measure both density and viscosity from the same sensor element. The resonant frequency shift correlates to density; the amplitude damping correlates to viscosity. This dual-parameter capability is valuable in paint, coating, adhesive, and polymer applications where both properties matter.
The LONN-V7 inline viscosity and density meter delivers both parameters from a single sensor. Laboratory measurement of both properties requires separate instruments (density meter + viscometer) and two separate analyses.
Conclusion
The inline vs laboratory density measurement decision is not about technology superiority — it’s about application fit. When evaluating inline vs laboratory density measurement options, match the method to the specific accuracy, speed, and compliance requirements of your application. Laboratory measurement delivers unmatched accuracy and legal defensibility. Inline measurement delivers unmatched speed, automation, and operational efficiency.
For process control, the choice is increasingly clear: inline measurement wins. The ability to detect and correct process deviations in real-time — rather than 30 minutes after they occur — transforms quality, yield, and safety performance. The economics are compelling: 4–6 month payback, $20,000+ annual savings per point, and elimination of hazardous sampling.
For custody transfer and regulatory compliance, laboratory measurement remains essential. The hybrid approach — inline for control, laboratory for verification — captures the benefits of both while managing the limitations of each.
The wrong choice is expensive. A laboratory-only approach in a process requiring real-time control yields off-spec product, wasted labor, and missed optimization opportunities. An inline-only approach for custody transfer creates legal risk and commercial disputes.
Match the measurement method to the application requirement. For specific guidance on your process, contact LONNMETER engineering — provide your fluid type, accuracy requirement, control strategy, and regulatory constraints, and we will recommend the optimal measurement architecture.
- Browse the full LONNMETER inline density meter product range
- Contact our technical team for application-specific recommendations
- Download the Technical Specifications Catalog
For related comparisons, see our guides on tuning fork vs ultrasonic density meter and how to choose the right density meter.
About LONNMETER: LONNMETER manufactures inline density meters (tuning fork, ultrasonic, Coriolis) for chemical, petroleum, mining, and food & beverage applications. All instruments are certified to ATEX, IECEx, and ISO 9001 standards. Global distribution across 130+ countries; technical support in 12 languages.