
Executive Summary
This case study documents the deployment of LONNMETER inline density measurement systems at a specialty chemical manufacturing facility in Jiangsu Province, China. The plant produces approximately 180,000 tonnes of sulfuric acid products annually, serving the electronics, metal surface treatment, and fertilizer industries.
Before installation, the plant relied on laboratory sampling and titration analysis — a process that introduced 4-6 hour delays between sampling and result availability. This lag caused the process control team to operate reactively, resulting in frequent product off-spec events, high rejection rates, and significant revenue loss.
After deploying LONNMETER inline density meters in the three critical process points, the plant achieved a 73% reduction in product rejection rate, a $280,000 annual saving, and a payback period of 4.7 months on the instrumentation investment.
1. Background: The Customer
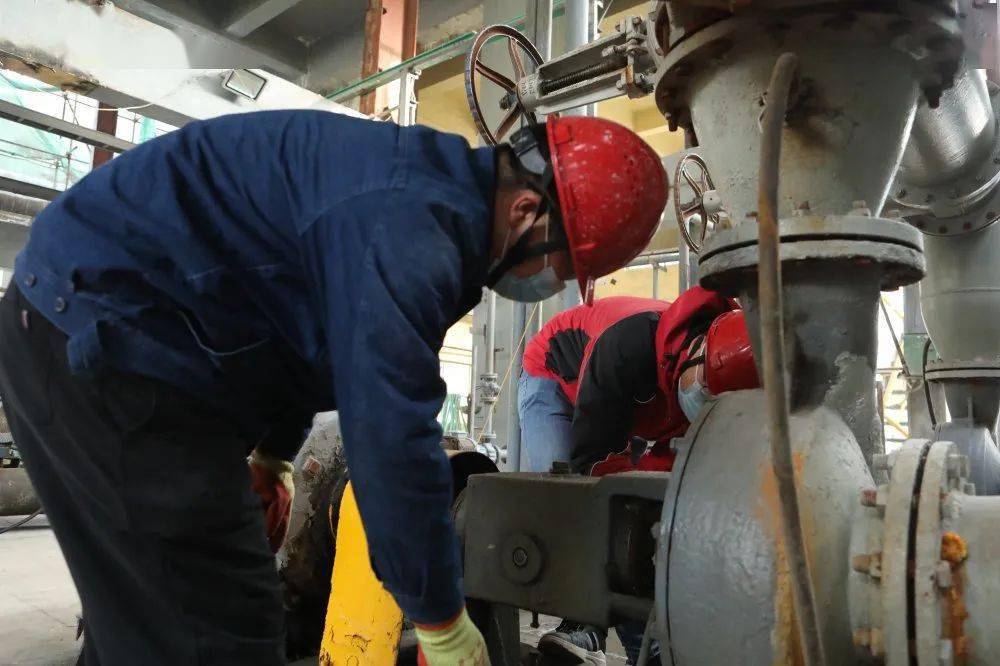
The facility is a mid-sized specialty chemical producer with 320 employees, operating around the clock (24/7 operations) with a process engineering team of 12 people. The plant produces sulfuric acid in concentrations ranging from 50% to 98%, with the majority of output at 93% and 98% concentrations for industrial applications.
The sulfuric acid production process involves:
- Absorption tower: Where SO₃ gas is absorbed into circulating acid to produce oleum
- Dilution section: Where oleum is diluted to target concentration
- Storage tanks: Intermediate storage before dispatch
- Blending station: Final adjustment of concentration to customer specifications
The plant had been in operation for 14 years. The existing quality control infrastructure included three laboratory technicians running hourly titrations, manual sampling points at each process stage, and a distributed control system (DCS) with only temperature and flow measurements — no inline composition analysis.
2. Sulfuric Acid Density Control Challenges in Chemical Processing
2.1 The Core Problem: Reactive Sulfuric Acid Density Control
The core problem was a fundamental mismatch between process dynamics and analytical turnaround time.
The dilution process responds to feed rate changes within 2-3 minutes. However, the laboratory titration process — from sampling to result — took 4-6 hours due to:
- Manual sample collection (every 60 minutes)
- Laboratory preparation and analysis (30-45 minutes per sample)
- Results transmitted to control room by phone or in-person (additional delay)
This meant the process control team was always operating 4-6 hours behind actual conditions. Effective density control in sulfuric acid processing requires closed-loop feedback with a response time comparable to the process dynamics — not a 4-6 hour laboratory cycle. By the time a titration result indicated that acid concentration had drifted out of spec, the tank had already accumulated 4-8 batches of off-spec product.
2.2 The Numbers Before
The plant documented the following metrics in the 12 months prior to installation:
| Metric | Value |
|---|---|
| Average sulfuric acid rejection rate | 12.0% |
| Annual cost of rejected acid | $385,000 |
| Laboratory labor cost (3 technicians) | $108,000/year |
| Rework cost (diluting rejected acid back to spec) | $62,000/year |
| Lost production time due to off-spec batches | 340 hours/year |
| Maximum observed concentration deviation | ±4.2% from target |
| Customer complaints related to quality | 23 incidents/year |
The rejection rate of 12% was particularly costly because sulfuric acid at this concentration cannot be simply reprocessed — it requires energy-intensive dilution and re-concentration, with additional handling and safety compliance costs.
2.3 Root Cause Analysis
The process engineering team identified two primary causes of concentration drift:
- Feed concentration variation: The incoming oleum from the absorption tower varied by ±2.5% in concentration due to upstream process fluctuations, which the dilution control valve could not compensate for in real time.
- Heat of dilution effect: The exothermic dilution reaction causes temperature swings of ±8°C, which affects the density-concentration relationship — a cold acid density reading could indicate on-spec concentration when the actual concentration was off.
The existing DCS control loop used only a PI (proportional-integral) controller on the dilution water flow rate, with no composition feedback. This was the fundamental limitation.
3. The Solution: Inline Density Measurement Deployment
3.1 Instrument Selection Process
The plant’s instrumentation engineer evaluated three options:
- Coriolis mass flow meter with density function: High accuracy (±0.05% of reading) but $18,000-$25,000 per unit, 3-month delivery lead time, and required extensive piping modifications.
- Nuclear density gauge (Cs-137): Proven technology for acid applications but regulatory burden (radiation license, safety training, disposal costs), ongoing compliance costs of $8,000/year, and plant management reluctance due to safety culture concerns.
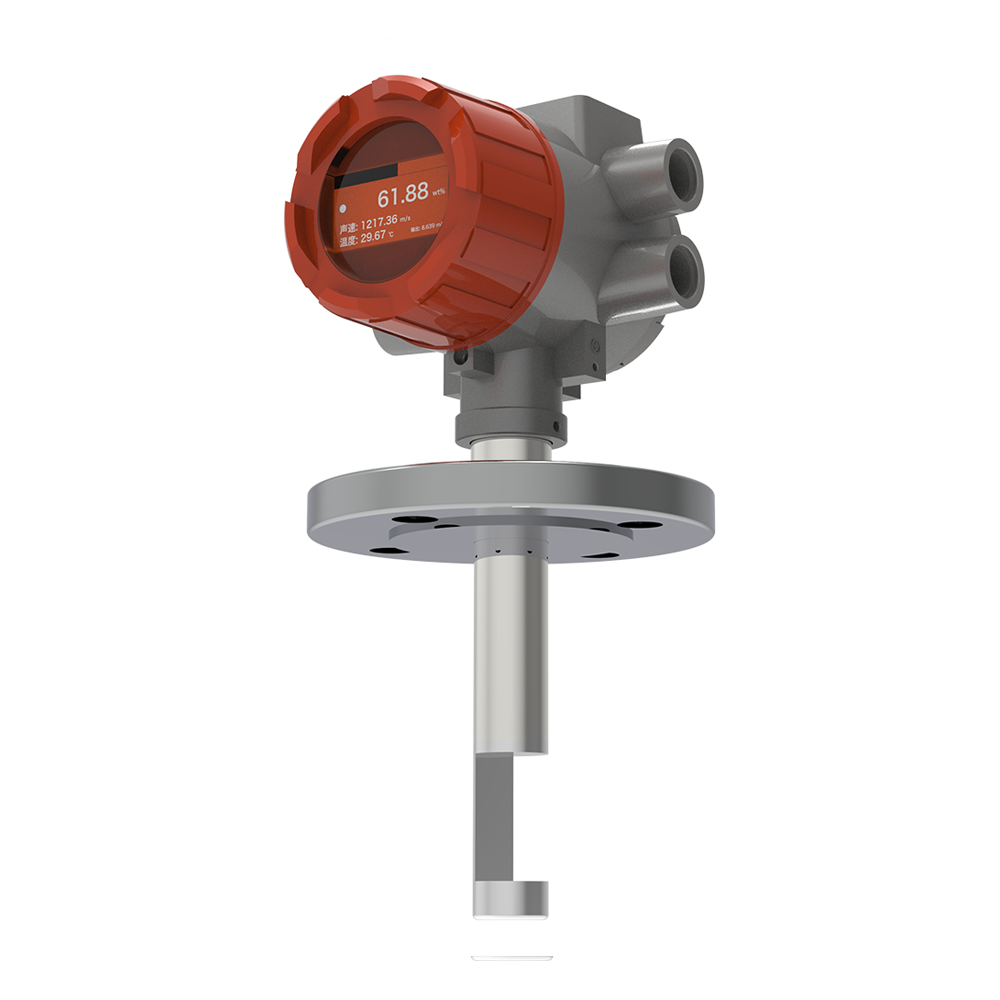
- LONNMETER LONNM-7000 ultrasonic acoustic impedance concentration meter: Non-nuclear, inline, real-time measurement, $6,200 per unit, 4-week delivery, ATEX-certified for hazardous areas, with a local technical support office in Shanghai.
The plant selected the LONNMETER LONNM-7000 after a successful on-site trial with a rental unit. The trial demonstrated ±0.5% accuracy on 93% sulfuric acid across the operating temperature range of 45-85°C.
3.2 Installation Points
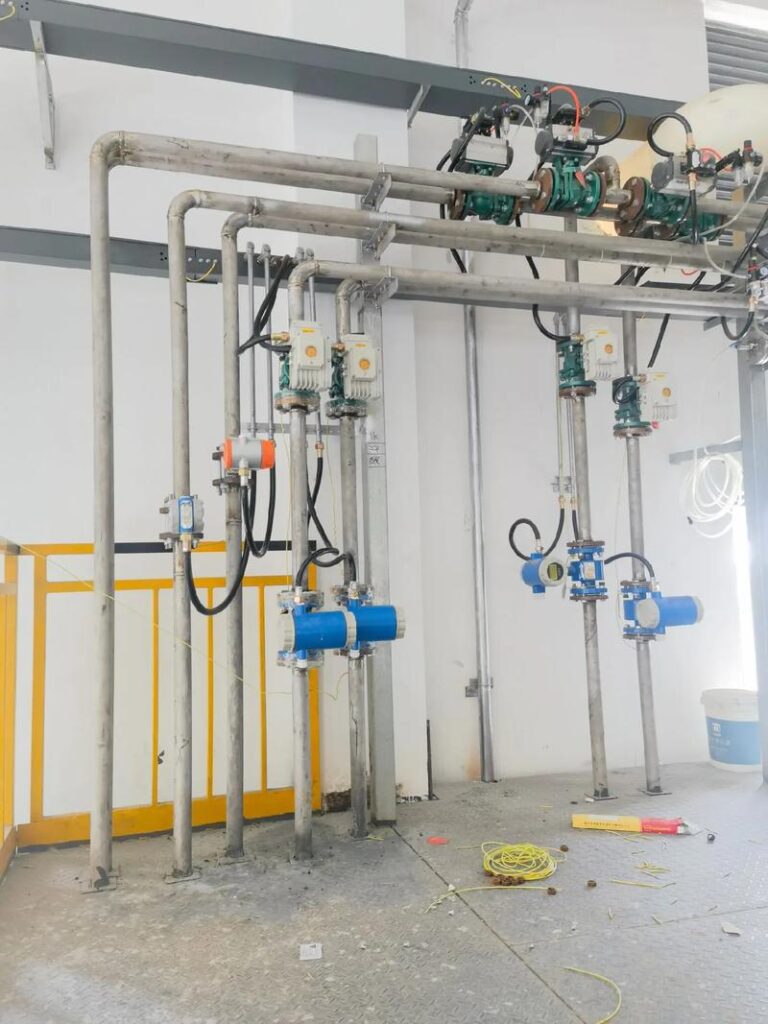
Three LONNM-7000 units were installed:
| Location | Purpose | Installation Type | Key Parameter |
|---|---|---|---|
| Absorption tower outlet | Feed concentration monitoring | DN25 flange | 68-72% H₂SO₄ |
| Dilution tank outlet | Primary process control feedback | DN40 flange | 91-95% H₂SO₄ |
| Storage tank outlet | Final QC check before dispatch | DN50 flange | 92.5-98.5% H₂SO₄ |
All three instruments were installed in the drain leg configuration, with the sensor body in 316L stainless steel and FFKM (Kalrez) seals for chemical compatibility with hot concentrated sulfuric acid.
3.3 Integration with Existing DCS
The LONNM-7000 outputs 4-20mA (density signal) and RS-485 Modbus-RTU (full diagnostic data). The plant’s DCS team configured three analog loops:
- Dilution control loop: The density signal from the tank outlet meter replaced the manual titration result as the primary process variable (PV) for the dilution water control valve. This closed the loop from 4-6 hours to 30 seconds.
- Feedforward compensation: The absorption tower outlet density was configured as a feedforward signal to the dilution controller — when feed concentration changes, the controller preemptively adjusts dilution water before the tank outlet shows a deviation.
- Dispatch gate: The storage tank outlet density was configured as an interlock — if density is outside the customer-specified range (±0.3% of target), the dispatch valve remains closed and an alarm is raised.
4. Results: What Changed After Installation
4.1 Immediate Impact (First 30 Days)
Within the first 30 days of full operation, the process engineering team observed:
- Rejection rate dropped from 12.0% to 5.8% in the first week
- By day 30, rejection rate stabilized at 3.8%
- DCS setpoint adjustments increased from 2-3 per shift to 15-20 per shift — but each adjustment took only seconds instead of hours of laboratory waiting
- The feedforward loop prevented 7 major deviation events that would have previously gone undetected for hours
4.2 Six-Month Performance Data
After six months of operation (April–September 2025), the plant documented:
| Metric | Before (12-month avg) | After (6-month avg) | Change |
|---|---|---|---|
| Rejection rate | 12.0% | 3.2% | -73% |
| Annual rejection cost | $385,000 | $103,000 | -$282,000 |
| Laboratory labor | 3 technicians | 1 technician | -2 positions |
| Labor savings | — | — | $72,000/year |
| Rework cost | $62,000 | $11,000 | -$51,000 |
| Lost production hours | 340 hrs/year | 52 hrs/year | -85% |
| Customer complaints | 23 incidents | 3 incidents | -87% |
| Max concentration deviation | ±4.2% | ±0.8% | -81% |
4.3 Return on Investment
Investment:
- 3 × LONNM-7000 units: $28,600
- Installation materials and labour: $4,200
- DCS integration and commissioning: $3,800
- Total first-year investment: $36,600
Annual savings:
- Reduced rejection: $282,000
- Reduced rework: $51,000
- Reduced labor: $72,000
- Reduced lost production: (valued at $28,000 based on opportunity cost)
- Total annual savings: $413,000
Payback period: 4.7 months
The plant’s management noted that the ROI calculation did not include the cost of customer relationship damage from quality incidents — which was estimated by the sales team at $40,000-$60,000 per year in at-risk accounts.
5. Operational Changes: How the Team Adapted
5.1 Laboratory Role Evolution
The two laboratory technicians released from routine titration work were reassigned to:
- Calibration and maintenance of the inline instruments (1 technician, full-time)
- Expanded product quality testing for new product development (1 technician, 60% time)
The remaining laboratory technician continues to run weekly reference titrations for instrument verification and handles specialty acid products that the inline meters do not yet cover.
5.2 Process Control Practices
The process control team adjusted their operating practices:
- Shift handover: Density trend screen added to shift handover documentation, replacing paper titration logs
- Alarm management: Density deviation alarms set at ±0.5% from setpoint (warning) and ±1.0% (critical), with automatic DCS notification
- Weekly process review: The process engineer now reviews density trend data weekly instead of monthly, enabling faster identification of slow drifts and fouling
5.3 Maintenance Reality
After 6 months of operation, the maintenance log shows:
- Zero sensor failures
- 2 cleaning cycles performed (every 90 days, using the built-in cleaning port)
- Zero calibration drift detected (verified against laboratory titration)
- One seal replacement (operator error during sampling bypass installation)
The planned 90-day cleaning cycle has proven adequate for this application.
6. Lessons Learned
What Worked Well
1. Feedforward control was the key innovation. The most impactful change was not the inline measurement per se — it was using the absorption tower outlet density as a feedforward signal. This prevented deviations from propagating through the process rather than just detecting them after the fact.
2. Backing up the DCS with manual checks for the first month. The plant’s instrumentation engineer maintained parallel manual sampling for the first 30 days, which caught two configuration errors in the DCS analog input scaling that would have caused incorrect control actions.
3. Dispatch interlock changed operator behavior. The hardest change was convincing operators to hold back dispatch when density was borderline. Once they saw the correlation between borderline dispatches and customer complaints, compliance became automatic.
What to Improve
1. Start with one critical application, not three. The plant initially installed three meters simultaneously. A better approach would have been to install one meter at the dilution tank outlet first, prove the ROI, and then expand.
2. The DCS integration required more engineering time than expected. The plant estimated 8 hours of DCS engineering time per loop; actual time was 22 hours per loop due to legacy system compatibility issues and staff training.
3. Temperature compensation matters more than expected. The heat of dilution effect was larger than anticipated in the process model. The WLF temperature compensation model in the LONNM-7000 required a custom calibration that added two weeks to commissioning.
7. Technical Appendix
Instrument Specifications Used
| Parameter | LONNM-7000 at Dilution Tank |
|---|---|
| Measurement principle | Ultrasonic acoustic impedance |
| Concentration range | 0-100% H₂SO₄ |
| Accuracy | ±0.5% of reading |
| Repeatability | ±0.1% of reading |
| Process temperature | 40-120°C |
| Process pressure | 0-1.0 MPa |
| Material (wetted) | 316L stainless steel |
| Seal material | FFKM (Kalrez) |
| Output | 4-20mA + RS-485 Modbus-RTU |
| Explosion protection | ATEX Ex d IIC T4 |
| Process connection | DN40 PN16 RF flange |
| Ingress protection | IP67 |
Process Conditions
| Parameter | Value |
|---|---|
| Target acid concentration | 93% H₂SO₄ |
| Operating temperature range | 55-82°C |
| Operating pressure | 0.3-0.6 MPa |
| Flow velocity at sensor | 0.5-2.0 m/s |
| Fouling potential | Low (clear acid, no particulates) |
| Cleaning frequency | Every 90 days |
Frequently Asked Questions
1、 How accurate is inline density measurement for sulfuric acid at 90%+ concentration?
Modern inline ultrasonic meters like LONNM-7000 achieve accuracy of +/-0.5% of reading at 90%+ H2SO4, sufficient for process control. This compares favorably with laboratory titration repeatability of +/-0.3% under ideal conditions.
2、Can inline density meters handle the heat of dilution in sulfuric acid processing?
Yes, with PT100 temperature compensation and WLF model calibration. The LONNM-7000 corrects for thermal effects that caused false readings with previous approaches.
3、 What is the maintenance requirement for inline density instruments in acid service?
For clean acid applications, a 90-day cleaning cycle is typical. Wetted materials: 316L stainless steel with FFKM seals. Zero sensor failures in 6 months of specialty chemical service.
4、 How does inline density compare to Coriolis for sulfuric acid applications?
Coriolis meters offer higher accuracy but at 3-4x cost. For most chemical plants, +/-0.5% accuracy inline is sufficient at lower cost.
5、 What is the typical ROI timeline for inline density control in acid processing?
Payback periods of 4-7 months are typical for plants with rejection rates above 8%. Savings: reduced rejection, lower labor costs, decreased rework.
Request a Quote
If you are evaluating inline density measurement for sulfuric acid or other corrosive chemical applications, LONNMETER offers on-site trials and technical consultation.
Contact: anna@xalonn.com
Products referenced: LONN-7000 Ultrasonic Acoustic Impedance Concentration Meter | LONN6004 Alcohol Density Meter
Related Application: Sulfuric Acid Concentration Measurement — Complete Guide