A copper concentrator we work with lost roughly 1.2% of recoverable metal for most of a quarter, and nobody on site could tell you why. The flotation cells looked normal. The reagents were dosed on schedule. The grade in the feed hadn't moved. The number that was quietly lying was the slurry density — the pulp density of the cyclone overflow feeding the roughers — and the lab was sampling it by hand every two hours, which in a circuit that turns over in minutes is barely better than guessing.
That story is why this article exists. Not to sell you a meter, but to walk through what actually happens when you try to control slurry density online in a mine, why we almost always reach for a tuning-fork sensor first in abrasive slime, and where a clamp-on ultrasonic cell is the smarter call. I've put both in the line. I've also watched a badly installed one throw away every dollar it saved.

The short answer

If the stream is abrasive, thick with solids, or prone to coating — which is most of mining — a tuning-fork density meter is usually the right first pick because the fork sits in the flow and shrugs off what would clog an exposed cell. A clamp-on ultrasonic wins when you cannot or will not cut the pipe, when the line is clean enough between taps, and when a non-intrusive sensor is worth its lower accuracy. Neither is “better.” They solve different problems, and the wrong choice is almost always an install or a medium mismatch, not the hardware.

Why a concentrator loses sleep over slurry density

Flotation is a density game whether the metallurgists say so or not. The rougher wants a target percent solids — too thin and the cells flood with water and the air bubbles can't carry the mineral; too thick and the slurry turns into glue the bubbles can't rise through. We've seen plants run the rougher at 30% solids when 38% was the design point, simply because nobody trusted the density number they had. That 8-point gap was worth low single-digit percent recovery across the year. On a 50,000-tonne-per-day operation, "low single digit" is not low.

Slurry density control is a recovery lever before it is a measurement task, and that is why it shows up in three other places too:

  • Grinding circuit control. The cyclone overflow density sets how fine you grind. Chase the wrong number and you either over-grind (wasted power, slimy tails) or under-grind (mineral locked in the rock).
  • Reagent economy. Frother and collector are dosed against mass of solids. Dose to a wrong density and you pour chemical down a sump.
  • Mass balancing and accounting. Every tonne moved through the plant is reconciled against density. A biased meter biases the whole picture, and the accounting team will blame the sampler before they blame the meter — usually wrongly.

The catch: slurry is the worst-behaved fluid you will ever try to weigh. Keeping slurry density honest in that mess is the actual job, and it is harder than the brochures admit. It fights back, and the fight is the whole job.
slurry density

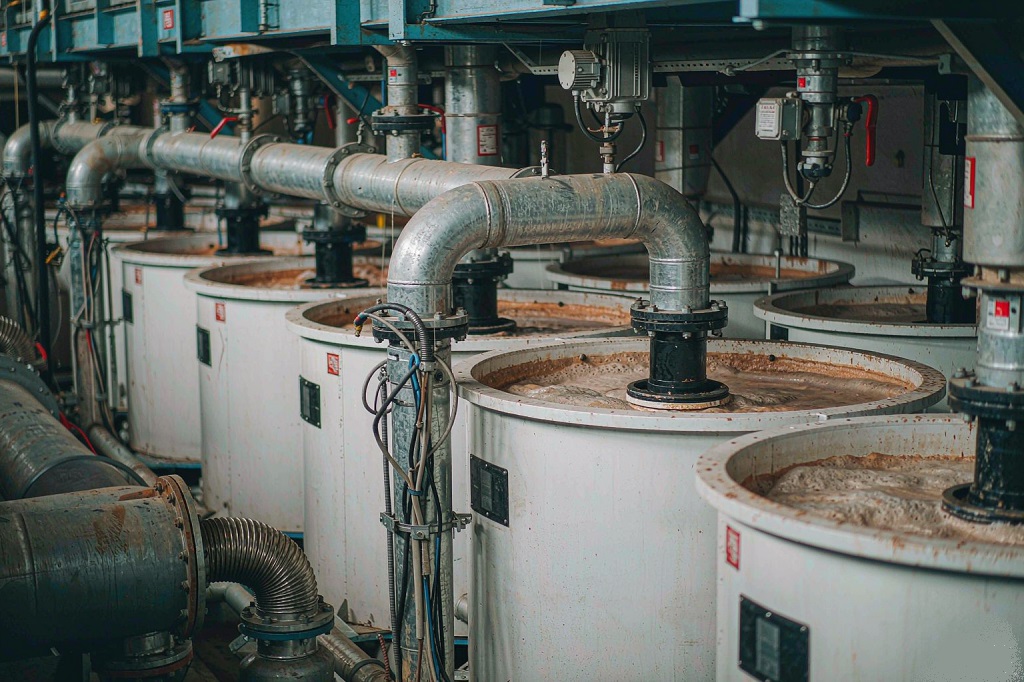
Figure 1. A concentrator flotation circuit. The rougher density you can’t see is the one quietly costing recovery — and the one a hand sample taken every two hours will never catch.

The slurry fights back

People imagine a density meter as a "fit and forget" box. In a mine it is a brawl. The things that have bitten us:

  • Abrasion. A slurry at 40% solids and 2 mm gangue walks through the wetted parts like sandpaper. A fork tine loses mass; a cell window frostes over. We pulled one fork after a season in an iron-ore DMS circuit and it had lost a measurable sliver off the tip. Density read heavy because the resonance shifted with the lost metal, not with the pulp.
  • Entrained air. Flotation tails are full of micro-bubbles. Bubbles wreck any acoustic or resonant measurement because they scatter and they lighten the apparent mass. A cell reading 15% low after a pump cavitation event is not broken. It is telling you the line has gas.
  • Coating and scaling. Lime, gypsum, magnetite, you name it. It plates the sensor and adds phantom mass. The fix is a wash, not a recalibration — but the first instinct on site is always to recalibrate, which teaches the meter to read the scale as correct.
  • Sampling lag. The lab result is old the moment it’s written. By the time a hand sample gets to the bench, the circuit has moved. This is the real reason plants distrust their own numbers, and it is the reason inline wins the argument before you discuss accuracy.
  • Pressure and two-phase. A line that isn’t full, or a tap on a high point, gives you process plus vapour. Plumbing, again, not electronics.

Here is the part worth tattooing on the panel: in our field logs, more than half of "bad density meter" calls were an install or a medium problem we could fix without touching the firmware. The meter was fine.

Two ways to weigh a slurry

Both technologies end up inferring density, but they grab it from opposite ends of the physics.

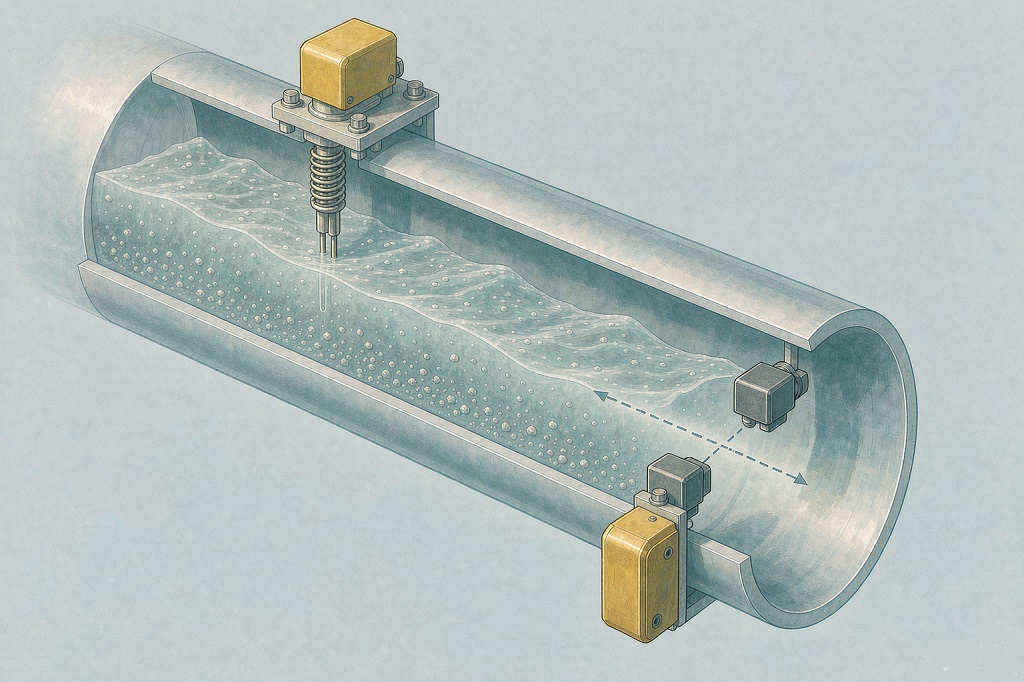
Tuning-fork (vibrating element). A fork sits in the stream and is driven at its resonant frequency. Density changes the effective mass the fork is dragging, so the frequency shifts. We read the shift. It is direct, it is immersed, and because the tines are solid metal it tolerates crud that would blind an optical or acoustic window. The cost is wear on those tines and a sensitivity to heavy coating if you never clean it.

Ultrasonic (sound speed). A pair of transducers fires a pulse through the pipe; the travel time maps to sound speed, and sound speed maps to density for a given fluid. Clamp-on versions sit outside the pipe and touch nothing — no wetted parts, no abrasion, no process break. The cost is that anything between the transducers that isn't your fluid — bubbles, scale on the pipe wall, a chunky solids load — bends the answer. It wants a cleaner, more homogeneous stream than a fork will tolerate.
mining slurry

Figure 2. Two ways to infer slurry density — an immersed tuning fork (left) versus a clamp-on ultrasonic pair firing through the pipe wall (right). Same fluid, opposite ends of the physics.


Tuning-fork

Clamp-on ultrasonic

Touches the slurry?

Yes, immersed fork

No, outside the pipe

Abrasion risk

On the tines (replaceable tips)

None on the sensor

Air / bubbles

Tolerates some

Poor — scatters the path

Coating

Needs periodic wash

Wall scale hurts it

Install

A weld-neck or insertion point

Clamps on a straight, clean span

Typical accuracy in slurry

±0.002 g/cm³ on our 700CM datasheet (±0.0001 repeatability)

Wider; model-dependent

Best fit

Abrasive, dirty, coating streams

Clean-ish line, no pipe cut

Where each one actually wins

We reach for the tuning-fork density meter when the slurry is the kind that chews instruments — dense medium separation, mill discharge, thickener underflow, most flotation feeds. The fork earns its place in slurry density service because it is immersed and built for the fight. On our LONN-700C class units we run hardened fork tips and a shorter tine precisely so a season of abrasion costs you a tip, not a sensor. You still have to wash it; coating is a discipline, not a feature.

We reach for the clamp-on ultrasonic density meter when the line is clean enough between the taps and the last thing the plant wants is a hot cut on a live, pressurized, sometimes-toxic line. Washeries with relatively uniform product, certain tailings returns, pilot skids you bolt on for a trial — those are its home. You trade a bit of accuracy for zero intrusion and a ten-minute install. For the non-nuclear case against nuclear gauges, see our non-nuclear density measurement breakdown.

One more honest point: if the stream is both abrasive and gassy, neither is happy. You fix the gas first — de-aerate, move the tap off the high point, get a full pipe — and then pick the sensor — and if you want the full trade table, our tuning-fork vs ultrasonic comparison spells it out. We’ve had calls where the “density meter selection” question was really a “why is my line full of air” question wearing a meter’s clothes.

What we build differently

This is where being a group company matters, and I'll say it plainly because it changes what you get. LONNMETER is not a trader who sticks a logo on someone else's cell. The same model runs from our mechanical-design desk, through the sensor R&D bench where we characterize each fork tine's resonance, into our own production line, and out as part of a solution our application engineers sized for your circuit. Design, R&D, manufacturing, and the solution delivery sit under one roof, so when a fork tip wears in a way the catalogue didn't predict, the fix goes back into the next batch we build — not into a supplier's backlog we don't control.
IMG 0641

Our inline tuning-fork density transmitter. Flanged insertion mount, orange LONN explosion-proof housing with local display — a production unit photographed from our own line, the type we put into abrasive slurry service.

ultrasonic system

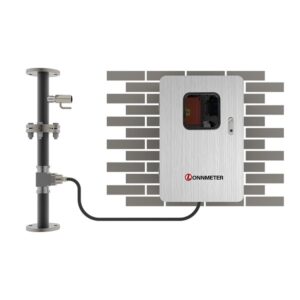
Our non-nuclear ultrasonic slurry density/concentration system. Pipe-mounted transducers wired to a wall-mounted transmitter — acoustic measurement with no radiation source, so no radiological permitting.

Concretely, for slurry we ship:

  • Tuning-fork density transmitters (the LONN-700C / LONN-700CM family) with wear-resistant tines — on the 700CM datasheet: 0–2 g/cm³ range, ±0.002 g/cm³ accuracy, ±0.0001 g/cm³ repeatability, 0–2000 cP viscosity, −25 to +120 °C, Ex d IIC T6 Gb, 4–20 mA and RS485.
  • Non-nuclear ultrasonic density/concentration systems (the LONN7000 / 7010 / 7020 series; see also our ultrasonic principle guide) — acoustic impedance, attenuation and sound-speed methods, with no radiation source. The probe faces are wear-resistant and high-finish for two-phase slurry with solids and bubbles, built to IP65, and it gives dual 4–20 mA plus RS485.
  • The solution around the sensor — sampling point selection, a straight-run and de-aeration spec, a calibration procedure against a traceable standard, and the integration so the number lands in the control room where someone can act on it with our application engineers. Start with our density meter selection guide.

A meter on a shelf is a cost. A meter wired into the loop with a verification habit is the thing that recovers the 1.2%.

Installing it without eating the savings

The install is where good slurry density meters go to die. The rules we repeat on every site, because every site forgets them once:

  • Keep 10 diameters of straight pipe upstream of the sensor and 5 downstream. Elbows and reducers twist the velocity profile and bias the reading before the sensor even thinks about it.
  • Put the tap below the high point and away from the pump discharge. Air pools up; pumps throw it. Two metres downstream of a calm section solves more “bad meter” calls than any firmware update.
  • On a fork, schedule the wash, don’t wait for the drift. A CIP or a wipe on a planned interval beats a surprise 0.004 g/cm³ bias during a campaign. Track tine wear if the stream is brutal — a worn tip is a calibration you didn’t know you made.
  • On an ultrasonic, clean the pipe wall at the clamps and confirm the span is full and steady before you trust the number. Scale on the outside reads almost as badly as scale on the inside.
  • Verify against a traceable standard on a cadence set by evidence, not the calendar. We log every two-point check — low and high reference — and trend the as-found error. A slow walk predicts the next failure; a flat line earns you a longer interval.

A habit that pays for the meter

ou don't need a lab to keep a field slurry meter honest. Two reference standards spanning your operating range, each with a certificate, and a logger. Circulate the low one until temperature is steady and the reading is flat for ten minutes; record the as-found number before you touch anything; repeat on the high one; plot both against the certificates. If both points shift together, it is a zero error — clean and re-zero. If only the top moves, suspect coating or a damaged cell — pull and bench-check. Accept for process control if you are within about 0.001 g/cm³ of the standard; tighten that for custody transfer.

Most of our mining base lands on a three-to-six-month check, shortened right after any process upset — a steam-out, a pressure spike, a fluid swap. The plants that treat the check as data, not paperwork, are the ones that stopped losing sleep over the number.

FAQ

Which density meter is best for abrasive mining slurry density control?
A tuning-fork, almost always. It sits in the flow and tolerates the solids and coating that blind an exposed cell. Go ultrasonic clamp-on only when the line is clean between taps and you can’t cut the pipe.
Can a clamp-on ultrasonic measure density in slurry at all?
It can, on the cleaner, more uniform streams — washeries, some tailings returns, trial skids. On gassy or heavily coated lines it suffers, because bubbles and wall scale bend the acoustic path.
Why does my slurry density meter read low after the pump?
Usually entrained air from cavitation or a high-point tap, not a fault. De-aerate, move the tap downstream of a calm section, confirm a full pipe, then re-check.
How often should a slurry density meter be calibrated?
Every three to six months in normal mining service, pulled in immediately after any process upset. Drive the interval from trended check data, not the date.
Does LONNMETER supply just the sensor or the whole loop?
Both. We build the tuning-fork and ultrasonic cells in-house and deliver the surrounding solution — sampling point, straight-run and de-aeration spec, traceable calibration, and DCS integration — so the number actually reaches the control room — talk to our application engineers about the full loop.


About the authors

Authored and field-reviewed by the LONNMETER GROUP Process Measurement Application Engineering team. LONNMETER GROUP designs, develops, and manufactures inline process-measurement instruments — density (tuning-fork family LONN-700C / LONN-700CM / LONN-V7; ultrasonic family LONN7000 / LONN-UFM / LONN7001), plus viscosity, concentration, flow, and level meters — and delivers them as engineered solutions across mining, chemical, food, energy, and wastewater. This piece draws on flotation and dense-medium circuits in our deployment base and on standard methods such as ASTM D4052 and ISO 15212-1.

Accuracy note: the figures here (recovery loss, density bias magnitudes, check intervals) are representative engineering values from field work on slurries near 1.0–1.6 g/cm³ and are given to show method and order of magnitude. Validate every number against your own circuit data sheet and a traceable standard before using it for accounting or quality release.

LONNMETER GROUP · Process Measurement Application Engineering — internal layout preview. SEO meta, Open Graph, and JSON-LD schema are configured above. Real product photographs (inline tuning-fork transmitter + LONN7000 ultrasonic system) embedded from the company asset library.

Leave a Reply

Your email address will not be published. Required fields are marked *